
Compare Astron Paper with Similar Stocks
Dashboard
With a Operating Losses, the company has a Weak Long Term Fundamental Strength
- Low ability to service debt as the company has a high Debt to EBITDA ratio of -31.42 times
- The company has been able to generate a Return on Equity (avg) of 1.63% signifying low profitability per unit of shareholders funds
Flat results in Mar 26
Risky - Negative EBITDA
Consistent Underperformance against the benchmark over the last 3 years
Stock DNA
Paper, Forest & Jute Products
INR 18 Cr (Micro Cap)
NA (Loss Making)
16
0.00%
1.13
-40.76%
0.26
Total Returns (Price + Dividend) 
Astron Paper for the last several years.
Risk Adjusted Returns v/s
Returns Beta

News
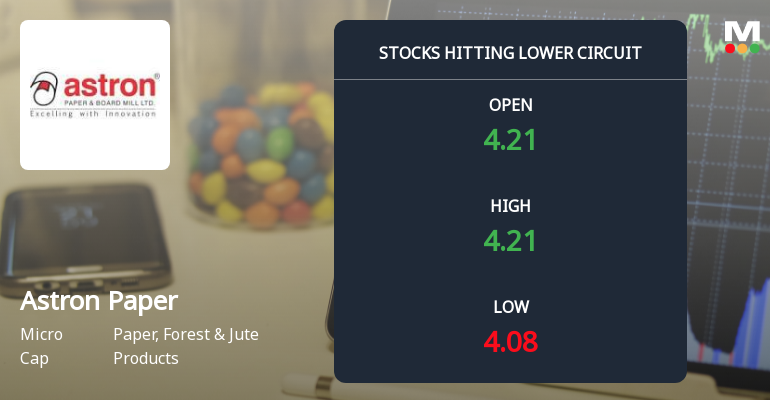
Astron Paper & Board Mill Ltd Locks at Lower Circuit With 5% Loss — Sellers Queue, No Buyers in Sight
At Rs 3.94, Astron Paper & Board Mill Ltd locked at its lower circuit of 5% on 27 Jul 2026, with sellers lined up but no buyers willing to absorb the supply. This freeze at the floor price highlights unfilled sell orders and a market unable to find demand at these levels.
Read full news article
Astron Paper & Board Mill Ltd Locks at Upper Circuit With 2.66% Gain — Buyers Queue, Sellers Absent
At Rs 4.33, the buying was done — not because demand dried up, but because the exchange wouldn't let the stock go any higher. Astron Paper & Board Mill Ltd locked at its upper circuit of 2.66% on 23 Jul 2026, with buyers queuing and no sellers willing to part with shares.
Read full news article
A 3.17% Single-Day Surge Takes Astron Paper & Board Mill Ltd to Its Upper Circuit Limit of Rs 4.30
At Rs 4.30, the buying was done — not because demand dried up, but because the exchange would not allow the stock to rise further. Astron Paper & Board Mill Ltd locked at its upper circuit of 5% on 22 Jul 2026, with buyers queuing and no sellers willing to part with shares, signalling unfilled demand at the ceiling price.
Read full news article Announcements
Corporate Insolvency Resolution Process (CIRP)-Invitation of Resolution Plan
28-Jul-2026 | Source : BSEInvitation for expression of Interest was made on 09.07.2026.
Results For The Financial Year Ended On 31.03.2026
01-Jun-2026 | Source : BSEApproval of the results for the financial year ended on 31.03.2026
Board Meeting Outcome for Outcome Of Board Meeting
01-Jun-2026 | Source : BSEOutcome of Meeting of the insolvency Resolution Professional - Approval of Audited Financial Results for the Quarter and Year ended 31 March 2026
Corporate Actions

No Upcoming Board Meetings

No Dividend history available

No Splits history available

No Bonus history available

No Rights history available
Quality key factors
Valuation key factors
Technicals key factors
 Technical Indicator Scale: Bearish, Mildly Bearish, Sideways, Mildly Bullish, Bullish Turned
 Shareholding Snapshot : Mar 2026
Shareholding Compare (%holding)
Non Institution
None
Held by 0 Schemes
Held by 0 FIIs
Kiritbhai Ghanshyambhai Patel (15.21%)
Dwarkesh Finance Limited (11.29%)
49.85%
Quarterly Results Snapshot (Consolidated) - Mar'26 - YoY

YoY Growth in quarter ended Mar 2026 is -92.05% vs -98.88% in Mar 2025
YoY Growth in quarter ended Mar 2026 is 46.07% vs -84.83% in Mar 2025
Half Yearly Results Snapshot (Consolidated) - Sep'25

Growth in half year ended Sep 2025 is -98.64% vs -40.92% in Sep 2024
Growth in half year ended Sep 2025 is 42.51% vs -392.37% in Sep 2024
Nine Monthly Results Snapshot (Consolidated) - Dec'25
YoY Growth in nine months ended Dec 2025 is -97.14% vs -58.97% in Dec 2024
YoY Growth in nine months ended Dec 2025 is 66.77% vs -793.31% in Dec 2024
Annual Results Snapshot (Consolidated) - Mar'26
YoY Growth in year ended Mar 2026 is -97.10% vs -69.04% in Mar 2025
YoY Growth in year ended Mar 2026 is 62.65% vs -405.89% in Mar 2025
About Astron Paper & Board Mill Ltd

Company Coordinates


