
Compare Atlanta Electric with Similar Stocks
Dashboard
High Management Efficiency with a high ROE of 0%
Strong ability to service debt as the company has a low Debt to EBITDA ratio of 1.87 times
Healthy long term growth as Net Sales has grown by an annual rate of 0% and Operating profit at 0%
With a growth in Net Profit of 115.1%, the company declared Very Positive results in Mar 26
Majority shareholders : Promoters
Stock DNA
Heavy Electrical Equipment
INR 14,084 Cr (Small Cap)
71.00
60
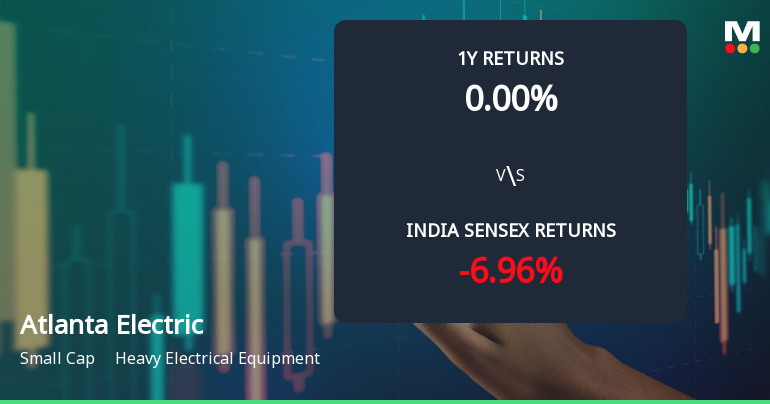
0.00%
-0.08
27.74%
18.40
Total Returns (Price + Dividend) 
Atlanta Electric for the last several years.
Risk Adjusted Returns v/s
Returns Beta

News
Atlanta Electricals Ltd Technical Momentum Shifts Signal Bullish Outlook
Atlanta Electricals Ltd, a small-cap player in the Heavy Electrical Equipment sector, has experienced a notable shift in its technical momentum, moving from a mildly bullish stance to a more confident bullish trend. Despite a recent dip in price, key technical indicators such as the MACD and On-Balance Volume (OBV) suggest strengthening momentum, supporting a positive outlook for investors.
Read full news article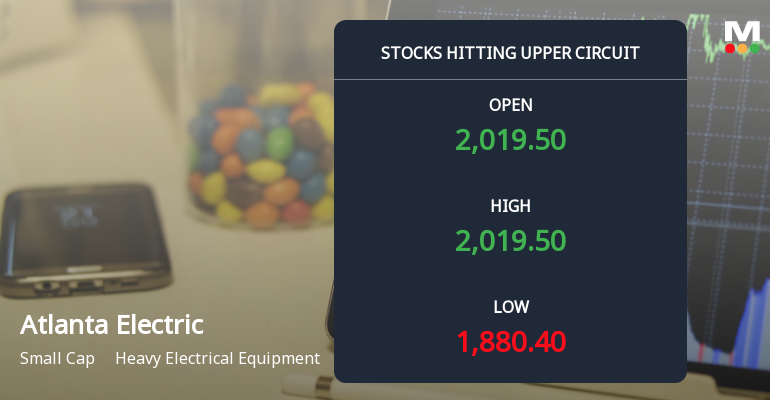
Above All Moving Averages and Now at Upper Circuit: Atlanta Electricals Ltd Gains 5% in a Single Session
At Rs 2,011.4, the buying was done — not because demand dried up, but because the exchange wouldn't let the stock go any higher. Atlanta Electricals Ltd locked at its upper circuit of 5% on 22 Jun 2026, with buyers queuing and no sellers willing to part with shares.
Read full news article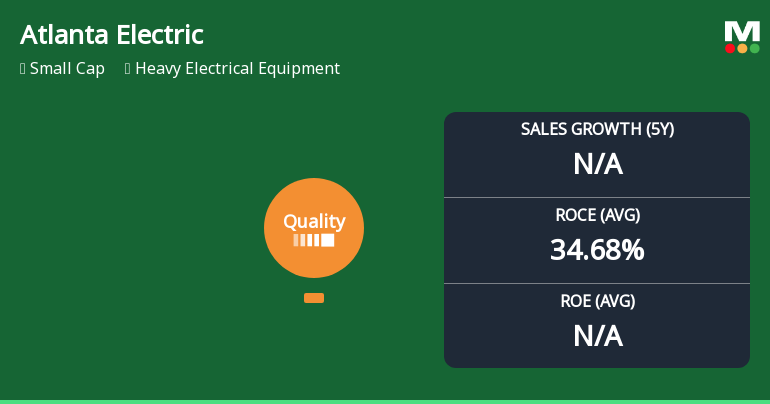
Atlanta Electricals Ltd Quality Grade Downgrade: A Detailed Analysis of Business Fundamentals
Atlanta Electricals Ltd, a prominent player in the heavy electrical equipment sector, has recently seen its quality grade downgraded from excellent to good by MarketsMOJO as of 16 June 2026. This shift reflects nuanced changes in the company’s business fundamentals, including profitability metrics, debt levels, and operational consistency. Despite the downgrade, the stock retains a Buy rating with a Mojo Score of 70.0, signalling continued investor interest amid evolving financial dynamics.
Read full news article Announcements
Announcement under Regulation 30 (LODR)-Press Release / Media Release
03-Jun-2026 | Source : BSEMedia Release on receipt of order
Announcement under Regulation 30 (LODR)-Award_of_Order_Receipt_of_Order
03-Jun-2026 | Source : BSEIntimation of receipt of order aggregating to Rs. 285.15 Crore
Announcement under Regulation 30 (LODR)-Analyst / Investor Meet - Intimation
26-May-2026 | Source : BSEIntimation about Plant Visit of Investor Group.
Corporate Actions

No Upcoming Board Meetings

No Dividend history available

No Splits history available

No Bonus history available

No Rights history available
Quality key factors
Valuation key factors
Technicals key factors
 Technical Indicator Scale: Bearish, Mildly Bearish, Sideways, Mildly Bullish, Bullish Turned
 Shareholding Snapshot : Mar 2026
Shareholding Compare (%holding)
Promoters
None
Held by 11 Schemes (3.55%)
Held by 21 FIIs (2.4%)
Narharibhai S. Patel Family Trust (43.63%)
Hdfc Mutual Fund - Hdfc Manufacturing Fund (1.4%)
4.86%
Quarterly Results Snapshot (Standalone) - Mar'26 - QoQ

QoQ Growth in quarter ended Mar 2026 is 58.41% vs 48.86% in Dec 2025
QoQ Growth in quarter ended Mar 2026 is 115.10% vs 63.64% in Dec 2025
Half Yearly Results Snapshot (Standalone) - Sep'25
Not Applicable: The company has declared_date for only one period
Not Applicable: The company has declared_date for only one period
Nine Monthly Results Snapshot (Standalone) - Dec'25
Not Applicable: The company has declared_date for only one period
Not Applicable: The company has declared_date for only one period
Annual Results Snapshot (Standalone) - Mar'26
YoY Growth in year ended Mar 2026 is 48.80% vs 43.41% in Mar 2025

YoY Growth in year ended Mar 2026 is 82.93% vs 86.81% in Mar 2025
About Atlanta Electricals Ltd

Company Coordinates


