
Compare Volt.Transform. with Similar Stocks
Dashboard
Low Debt Company with Strong Long Term Fundamental Strength
- Healthy long term growth as Net Sales has grown by an annual rate of 25.48% and Operating profit at 38.05%
- The company is Net-Debt Free
- The company has been able to generate a Return on Equity (avg) of 18.48% signifying high profitability per unit of shareholders funds
Negative results in Mar 26
With ROE of 17, it has a Very Expensive valuation with a 5.3 Price to Book Value
High Institutional Holdings at 55.44%
Stock DNA
Heavy Electrical Equipment
INR 9,460 Cr (Small Cap)
31.00
43
1.07%
-0.06
17.04%
5.26
Total Returns (Price + Dividend) 
Latest dividend: 100.05730659025788 per share ex-dividend date: Jul-24-2026
Risk Adjusted Returns v/s
Returns Beta

News
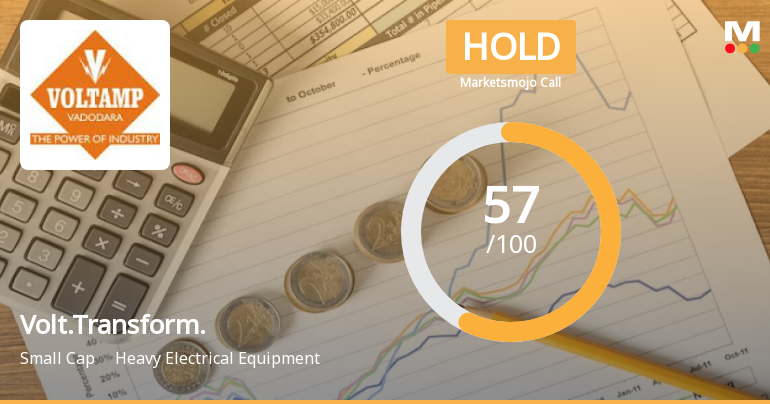
Voltamp Transformers Ltd is Rated Hold
Voltamp Transformers Ltd is rated 'Hold' by MarketsMOJO, with this rating last updated on 05 May 2026. However, the analysis and financial metrics discussed here reflect the company’s current position as of 26 July 2026, providing investors with an up-to-date view of its fundamentals, valuation, financial trends, and technical outlook.
Read full news articleWhen is the next results date for Voltamp Transformers Ltd?
The next results date for Voltamp Transformers Ltd is scheduled for July 31, 2026....
Read full news article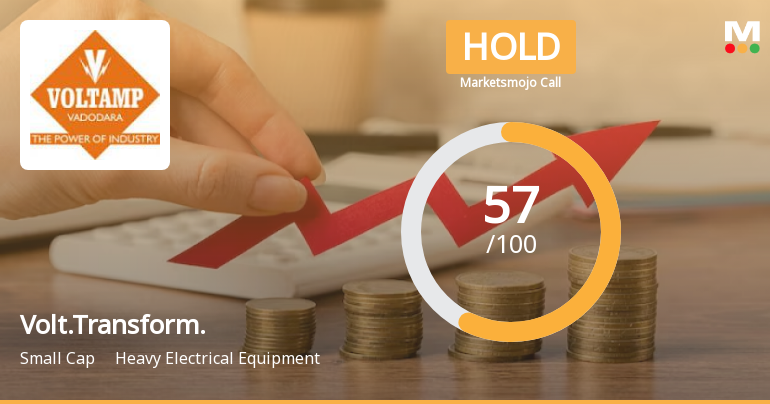
Voltamp Transformers Ltd is Rated Hold
Voltamp Transformers Ltd is rated 'Hold' by MarketsMOJO, with this rating last updated on 05 May 2026. However, the analysis and financial metrics discussed here reflect the stock's current position as of 15 July 2026, providing investors with an up-to-date view of the company's fundamentals, valuation, financial trends, and technical outlook.
Read full news article Announcements
Board Meeting Intimation for Inter Alia To Consider And Approve Unaudited Financial Results Of The Company For The Quarter Ended On June 30 2026.
23-Jul-2026 | Source : BSEVoltamp Transformers Ltdhas informed BSE that the meeting of the Board of Directors of the Company is scheduled on 31/07/2026 inter alia to consider and approve Unaudited Financial Results of the Company for the Quarter ended on June 30 2026.
Compliances-Certificate under Reg. 74 (5) of SEBI (DP) Regulations 2018
11-Jul-2026 | Source : BSECompliance Certificate under Regulation 74(5) of SEBI (DP) Regulations 2018.
Announcement under Regulation 30 (LODR)-Newspaper Publication
08-Jul-2026 | Source : BSENewspaper publication of 59th Annual General Meeting Record date for dividend and E-voting information
Corporate Actions

31 Jul 2026

Voltamp Transformers Ltd has declared 1000% dividend, ex-date: 24 Jul 26

No Splits history available

No Bonus history available

No Rights history available
Quality key factors
Valuation key factors
Technicals key factors
 Technical Indicator Scale: Bearish, Mildly Bearish, Sideways, Mildly Bullish, Bullish Turned
 Shareholding Snapshot : Jun 2026
Shareholding Compare (%holding)
Promoters
None
Held by 22 Schemes (28.98%)
Held by 158 FIIs (21.53%)
Kunjal Lalitkumar Patel (30.0%)
Hdfc Small Cap Fund (6.8%)
11.22%
Quarterly Results Snapshot (Standalone) - Mar'26 - YoY

YoY Growth in quarter ended Mar 2026 is -1.21% vs 23.93% in Mar 2025
YoY Growth in quarter ended Mar 2026 is -50.53% vs 3.53% in Mar 2025
Half Yearly Results Snapshot (Standalone) - Sep'25
Growth in half year ended Sep 2025 is 9.72% vs 17.38% in Sep 2024
Growth in half year ended Sep 2025 is 2.07% vs 30.17% in Sep 2024
Nine Monthly Results Snapshot (Standalone) - Dec'25
YoY Growth in nine months ended Dec 2025 is 17.34% vs 17.75% in Dec 2024

YoY Growth in nine months ended Dec 2025 is 12.64% vs 6.90% in Dec 2024
Annual Results Snapshot (Standalone) - Mar'26
YoY Growth in year ended Mar 2026 is 11.35% vs 19.68% in Mar 2025
YoY Growth in year ended Mar 2026 is -6.16% vs 5.87% in Mar 2025
About Voltamp Transformers Ltd

Company Coordinates


