T R I L

  • Market Cap: Small Cap
  • Industry: Heavy Electrical Equipment
  • ISIN: INE763I01026
  • NSEID: TARIL
  • BSEID: 532928
INR
316.35
-17.2 (-5.16%)
BSENSE

Jul 21, 03:30 PM

BSE+NSE Vol: 48.66 lacs

  • Price Points
  • Score
  • Mojo Parameters
  • Total Return
  • News and Corporate Actions
  • Key factors
  • Shareholding
  • Financials
  • CompanyCV
stock-summaryPrice Point
High/Low

1Day

52 Week

Valuation
Technical
Day's Volume

CASH

48.66 lacs (136.99%) Volume

Shareholding (Jun 2026)

FII

7.80%

Held by 102 FIIs

DII

1.54%

Held by 6 DIIs

Promoter

64.36%

Why is Transformers & Rectifiers India Ltd falling/rising?

21-Jul-2026

As of 20-Jul, Transformers & Rectifiers India Ltd's stock is experiencing a slight rise of 0.27% after two days of decline, but it has underperformed its sector by 0.56%. Despite a year-to-date growth of 16.93%, concerns about declining investor participation and trading volume may hinder its upward momentum.

As of 20-Jul, Transformers & Rectifiers India Ltd's stock price is currently rising, evidenced by a change of 0.9, or 0.27%, indicating a slight upward movement. This rise comes after two consecutive days of decline, suggesting a potential trend reversal. Despite the recent increase, the stock has underperformed its sector by 0.56% today, which may indicate ongoing challenges in attracting investor interest.<BR><BR>The stock's performance over the past week shows a decline of 3.90%, contrasting with a slight gain in the benchmark Sensex. However, it has demonstrated significant long-term growth, with a year-to-date increase of 16.93%, while the Sensex has decreased by 8.81% during the same period. This long-term growth is supported by a robust annual increase in net sales of 27.59% and an operating profit growth of 48.37%.<BR><BR>Despite the positive long-term indicators, there are concerns regarding falling investor participation, as evidenced by a 52.54% drop in delivery volume compared to the 5-day average. This decline in trading activity could be a factor limiting the stock's upward momentum. Nonetheless, the stock remains liquid enough for trading, with a delivery volume of 3.83 lacs on 17 July.<BR><BR>Overall, while the stock is currently rising, it faces challenges such as underperformance relative to its sector and declining investor participation, which could impact its future price movements.

View full answer

Are Transformers & Rectifiers India Ltd latest results good or bad?

21-Jul-2026

Transformers & Rectifiers India Ltd's latest results are concerning, with a 31.09% QoQ decline in net profit and a 26.87% QoQ drop in revenue, despite a slight improvement in operating margins. Overall, the company's performance raises caution among investors due to significant underperformance and declining institutional interest.

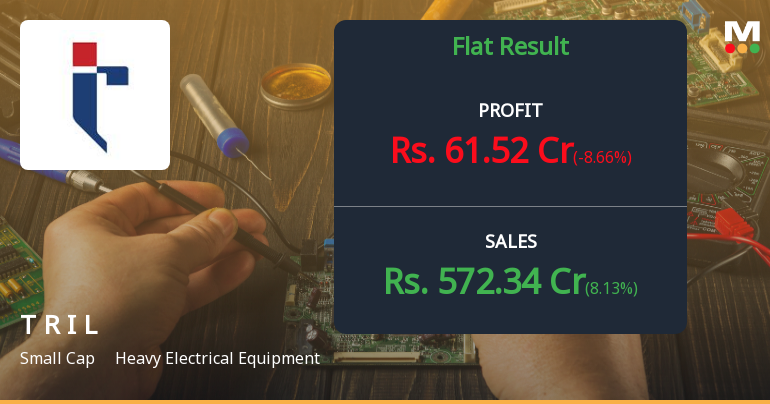
Transformers & Rectifiers India Ltd (TARIL) has reported mixed results for Q1 FY27, which can be characterized as concerning overall. <BR><BR>The company experienced a significant decline in net profit, which fell to ₹61.52 crore, reflecting a 31.09% decrease quarter-on-quarter (QoQ) and an 8.66% drop year-on-year (YoY). This decline raises questions about the company's execution capabilities and competitive positioning in a challenging market.<BR><BR>Revenue also saw a sharp contraction, decreasing by 26.87% QoQ to ₹572.34 crore, although it did show an 8.13% increase YoY. The volatility in revenue is indicative of the lumpy nature of orders in the capital goods sector, which can lead to significant fluctuations in quarterly performance.<BR><BR>On a positive note, TARIL's operating margin improved slightly to 16.31%, up 117 basis points QoQ, suggesting some operational efficiency despite lower revenue. However, the profit after tax (PAT) margin decreased to 11.23%, indicating that the company faced higher tax burdens and other costs.<BR><BR>The stock has also underperformed significantly, trading 45% below its 52-week high and down 37.85% over the past year, contrasting sharply with the overall sector's growth. This underperformance, coupled with a decline in institutional investor interest, suggests growing concerns among investors regarding the company's future prospects.<BR><BR>In summary, while there are some positive aspects, such as improved operating margins, the overall results indicate challenges that could be viewed as negative, particularly the sharp declines in profit and revenue. Investors may need to approach the stock with caution, monitoring future performance closely.

View full answer

Should I buy, sell or hold Transformers & Rectifiers India Ltd?

20-Jul-2026

When is the next results date for Transformers & Rectifiers India Ltd?

14-Jul-2026

The next results date for Transformers & Rectifiers India Ltd is July 20, 2026.

The next results date for Transformers & Rectifiers India Ltd is scheduled for July 20, 2026.

View full answer

How big is T R I L?

11-Jun-2026

As of 10th June, Transformers & Rectifiers India Ltd has a market capitalization of 9,493.00 Cr, with net sales of 2,508.79 Cr and a net profit of 264.39 Cr for the latest four quarters. Shareholder's funds are valued at 1,251.92 Cr, and total assets amount to 2,172.71 Cr.

As of 10th June, Transformers & Rectifiers India Ltd has a market capitalization of 9,493.00 Cr, categorizing it as a Small Cap company.<BR><BR>For the latest four quarters, the company reported net sales of 2,508.79 Cr and a net profit of 264.39 Cr.<BR><BR>As of the latest annual period, the shareholder's funds were valued at 1,251.92 Cr, while total assets amounted to 2,172.71 Cr.

View full answer

Who are in the management team of T R I L?

11-Jun-2026

The management team of T R I L includes Jitendra Mamtora (Chairman & Wholetime Director), Satyen Mamtora (Managing Director), Karuna Mamtora (Executive Director), and three Non-Executive & Independent Directors: Bhaskar Sen, Subir Kumar Das, and Rajendra S Shah, along with Rakesh Kiri as Company Secretary & Compliance Officer.

The management team of T R I L includes the following individuals:<BR><BR>1. **Jitendra Mamtora** - Chairman & Wholetime Director<BR>2. **Satyen Mamtora** - Managing Director<BR>3. **Bhaskar Sen** - Non-Executive & Independent Director<BR>4. **Karuna Mamtora** - Executive Director<BR>5. **Rakesh Kiri** - Company Secretary & Compliance Officer<BR>6. **Subir Kumar Das** - Non-Executive & Independent Director<BR>7. **Rajendra S Shah** - Non-Executive & Independent Director<BR><BR>If you need more details about their roles or contributions, feel free to ask!

View full answer

Who are the peers of the T R I L?

11-Jun-2026

T R I L's peers include TD Power Systems, Inox Wind, Azad Engineering, Volt.Transform., Quality Power El, Transrail Light, GE Power, and Skipper. T R I L has good management and growth risk, an average capital structure, and a 1-year return of -40.20%, better than Inox Wind but worse than its other peers.

Peers: The peers of T R I L are TD Power Systems, Inox Wind, Azad Engineering, Volt.Transform., Quality Power El, Transrail Light, GE Power, and Skipper.<BR><BR>Quality Snapshot: Excellent management risk is observed at TD Power Systems, Volt.Transform., Quality Power El, Transrail Light, and Skipper, while Average management risk is found at Inox Wind and GE Power. Good management risk is noted at Azad Engineering and T R I L. For growth, Excellent growth is seen at TD Power Systems, Inox Wind, Volt.Transform., Quality Power El, and Skipper, while Good growth is observed at Azad Engineering and T R I L. Below Average capital structure is noted at Inox Wind and Skipper, while Average capital structure is found at T R I L, and Excellent capital structure is observed at TD Power Systems, Volt.Transform., and Quality Power El.<BR><BR>Return Snapshot: The peer with the highest 1-year return is Quality Power El at 130.48%, while the peer with the lowest is Inox Wind at -55.83%. T R I L's 1-year return of -40.20% is better than Inox Wind's but worse than all other peers. Additionally, Transrail Light and Skipper have negative six-month returns.

View full answer

What does T R I L do?

10-Jun-2026

Transformers & Rectifiers India Ltd (TRIL) is a small-cap company in the Heavy Electrical Equipment industry, specializing in manufacturing transformers and rectifiers. As of March 2026, it reported net sales of ₹783 Cr and a net profit of ₹89 Cr, with a market cap of ₹9,493 Cr.

Overview:<BR>Transformers & Rectifiers India Ltd is a company operating in the Heavy Electrical Equipment industry, categorized as a Small Cap entity.<BR><BR>History:<BR>The company was originally incorporated in 1994 as 'Triveni Electric Company Limited' and later changed its name to 'Transformers and Rectifiers (India) Limited' in 1995. The latest quarterly results reported net sales and profit for the period ending March 2026.<BR><BR>Financial Snapshot:<BR>- Net Sales: 783 Cr (Quarterly Results - Mar 2026)<BR>- Net Profit: 89 Cr (Quarterly Results - Mar 2026)<BR>- Market Cap: INR 9,493 Cr (Small Cap)<BR><BR>Key Metrics:<BR>- P/E: 35.00<BR>- Industry P/E: 44<BR>- Dividend Yield: 0.00%<BR>- Debt-Equity: 0.11<BR>- Return on Equity: 17.45%<BR>- Price to Book: 6.33<BR><BR>Contact Details:<BR>Address: 427 P/3-4 & 431 P/1-2, Sarkhej Bavla Highway Sanand Ahmedabad Gujarat : 382213<BR>Tel: 91-2717-661661<BR>Email: info@transformerindia.com<BR>Website: http://www.transformerindia.com

View full answer

Is T R I L overvalued or undervalued?

27-Nov-2025

As of November 26, 2025, T R I L is considered overvalued with a valuation grade of "expensive," a PE ratio of 35.31, and a year-to-date return of -48.86%, underperforming the Sensex's 9.56%.

As of 26 November 2025, the valuation grade for T R I L has moved from very expensive to expensive, indicating a slight improvement in its valuation outlook. The company is currently considered overvalued. Key ratios include a PE ratio of 35.31, an EV to EBITDA of 24.49, and a PEG ratio of 0.34, which suggests that while growth expectations may be high, the current price does not adequately reflect the potential earnings growth.<BR><BR>In comparison to peers, T R I L's PE ratio is higher than that of Larsen & Toubro, which stands at 34.84, and significantly lower than Siemens, which is at 65.89. This positions T R I L in a relatively expensive category, especially when considering its performance against the broader market, where it has underperformed the Sensex over various time frames, particularly with a year-to-date return of -48.86% compared to the Sensex's 9.56%.

View full answer

How has been the historical performance of T R I L?

09-Nov-2025

T R I L has shown significant growth from Mar'20 to Mar'25, with net sales increasing from 700.95 Cr to 2,019.38 Cr, and profit after tax rising from 1.03 Cr to 216.43 Cr, alongside improvements in operating profit and total assets. Overall, the company has demonstrated robust growth in sales, profits, and asset base.

Answer:<BR>The historical performance of T R I L shows significant growth in various financial metrics over the years.<BR><BR>Breakdown:<BR>T R I L's net sales have increased from 700.95 Cr in Mar'20 to 2,019.38 Cr in Mar'25, demonstrating a strong upward trend. Total operating income followed a similar trajectory, rising from 700.95 Cr in Mar'20 to 2,019.38 Cr in Mar'25. The company's operating profit (PBDIT) also saw substantial growth, climbing from 51.35 Cr in Mar'20 to 359.16 Cr in Mar'25, with the operating profit margin improving from 7.33% to 16.22% during the same period. Profit before tax surged from 1.84 Cr in Mar'20 to 284.84 Cr in Mar'25, leading to a profit after tax of 216.43 Cr in Mar'25, up from just 1.03 Cr in Mar'20. The consolidated net profit increased significantly from 0.40 Cr in Mar'20 to 214.27 Cr in Mar'25. On the balance sheet, total assets grew from 932.12 Cr in Mar'20 to 2,172.71 Cr in Mar'25, while total liabilities also rose from 291.14 Cr to 282.77 Cr in the same timeframe. Cash flow from operating activities improved markedly, reaching 156 Cr in Mar'25 compared to just 16 Cr in Mar'20, although cash flow from investing activities showed a negative trend, indicating significant investments. Overall, T R I L has demonstrated robust growth in sales, profits, and asset base over the years.

View full answer

Is T R I L technically bullish or bearish?

27-Oct-2025

As of October 24, 2025, the market trend is neutral with mixed signals, showing mildly bearish indicators on weekly and monthly charts, while daily moving averages suggest a slight bullish trend, indicating caution is advised.

As of 24 October 2025, the technical trend has changed from mildly bullish to sideways. The current technical stance is neutral, with mixed signals across different indicators. The weekly MACD and KST are both mildly bearish, while the monthly indicators also reflect a mildly bearish sentiment. The daily moving averages show a mildly bullish trend, but this is countered by the overall sideways movement indicated by the Bollinger Bands on the weekly timeframe. The Dow Theory also supports a mildly bearish outlook on the weekly and monthly charts. Overall, the strength of the bearish indicators suggests caution, but the daily bullish signal provides some support.

View full answer

Who are the top shareholders of the T R I L?

17-Jul-2025

The top shareholders of T R I L include Jitendra Ujamsi Mamtora with 31.3%, mutual funds at 5.22%, foreign institutional investors at 10.94%, and individual investors holding 16.39%. The highest public shareholder is HSBC Midcap Fund with 3.65%.

The top shareholders of T R I L include the promoters, who hold the majority of the shares. The promoter with the highest holding is Jitendra Ujamsi Mamtora, with a stake of 31.3%. Additionally, mutual funds hold 5.22% of the shares across 18 schemes, while foreign institutional investors (FIIs) own 10.94% through 124 different entities. The highest public shareholder is HSBC Midcap Fund, which holds 3.65%. Individual investors collectively own 16.39% of the company.

View full answer

What is the bonus history of the T R I L?

06-Jun-2025

Transformers & Rectifiers India Ltd (T R I L) has a bonus history that includes a 1:1 bonus effective February 14, 2025, and a 1:9 bonus issued on June 14, 2013.

T R I L, or Transformers & Rectifiers India Ltd, has a notable bonus history. The most recent bonus issue was a 1:1 bonus, which is set to take effect on February 14, 2025. Prior to this, the company issued a bonus on June 14, 2013, with a ratio of 1:9. This means that for every nine shares held, shareholders received one additional share. If you have any more questions about the company or its financial activities, feel free to ask!

View full answer

Has T R I L declared dividend?

06-Jun-2025

Transformers & Rectifiers India Ltd has declared a 20% dividend, with an ex-date of May 9, 2025. Despite this, the dividend yield is 0%, but the company has shown significant price appreciation over various periods.

Transformers & Rectifiers India Ltd has declared a 20% dividend.<BR><BR>Dividend Details:<BR>- Percentage announced: 20%<BR>- Ex-date: 09 May 25<BR><BR>Dividend Yield: 0%<BR><BR>Total Returns by Period:<BR>Over the 6-month period, the price return was -1.1%, with no dividend return, resulting in a total return of -1.1%.<BR><BR>In the 1-year period, the price return was 44.32%, with no dividend return, leading to a total return of 44.32%.<BR><BR>For the 2-year period, the price return was 1153.62%, with a dividend return of 0.80%, culminating in a total return of 1154.42%.<BR><BR>During the 3-year period, the price return was 3339.4%, with a dividend return of 3.75%, resulting in a total return of 3343.15%.<BR><BR>In the 4-year period, the price return was 3598.74%, with a dividend return of 3.68%, leading to a total return of 3602.42%.<BR><BR>Over the 5-year period, the price return was 13277.92%, with a dividend return of 10.42%, culminating in a total return of 13288.34%.<BR><BR>Overall, Transformers & Rectifiers India Ltd has declared a dividend, but the dividend yield remains at 0%. The total returns over various periods show significant price appreciation, particularly over the longer term, indicating strong performance despite the lack of dividends in the recent periods.

View full answer
iScoreScore
Click here to find our call on this stock
Strong Sell
Sell
Hold
Buy
Strong Buy

Dashboard

1

High Management Efficiency with a high ROCE of 16.79%

 
2

Healthy long term growth as Net Sales has grown by an annual rate of 27.59% and Operating profit at 48.37%

 
3

Flat results in Jun 26

4

With ROCE of 21, it has a Expensive valuation with a 5.8 Enterprise value to Capital Employed

5

Falling Participation by Institutional Investors

6

Underperformed the market in the last 1 year

stock-summaryMojo Parameters

Mojo Parameters

Loading Valuation Snapshot...

Stock DNA

stock-summary
Industry

Heavy Electrical Equipment

stock-summary
Market cap

INR 9,595 Cr (Small Cap)

stock-summary
P/E

37.00

stock-summary
Industry P/E

44

stock-summary
Dividend Yield

0.00%

stock-summary
Debt Equity

0.11

stock-summary
Return on Equity

17.45%

stock-summary
Price to Book

6.61

Revenue and Profits:
Net Sales:
572 Cr
(Quarterly Results - Jun 2026)
Net Profit:
62 Cr
stock-summaryTotal Returns
Total Returns (Price + Dividend) stock-summary
Dividend Yield (0%)
TimePeriod
Price Return
Dividend Return
Total Return
3 Months
-5.06%
0%
-5.06%
6 Months
29.6%
0%
29.6%
1 Year
-38.22%
0%
-38.22%
2 Years
-11.63%
0%
-11.63%
3 Years
679.57%
0.22%
679.79%
4 Years
2019.6%
1.02%
2020.62%
5 Years
1723.34%
2.09%
1725.43%

Latest dividend: 0.1 per share ex-dividend date: May-10-2024

Risk Adjusted Returns v/s stock-summary
Returns Beta
Icon
Beta has not been calculated since enough price history is not available
stock-summaryNews & Corporate Actions

News

Announcements stock-summary

Announcement under Regulation 30 (LODR)-Analyst / Investor Meet - Intimation

16-Jul-2026 | Source : BSE

TARIL has arranged earnings conference call to discuss the Unaudited Standalone and Consolidated Financial Results of the Company for the quarter ended on 30th June 2026 on Tuesday 21st July 2026 at 04:00 p.m. (IST). We send herewith details of earnings conference call.

Compliances-Certificate under Reg. 74 (5) of SEBI (DP) Regulations 2018

15-Jul-2026 | Source : BSE

Compliance -Certificate under Reg. 74(5) of SEBI (DP) Regulations 2018 as of 30th June 2026 as received from RTA.

Board Meeting Intimation for Intimation Of Meeting Of Board Of Director Pursuant To Regulation 29 Of The SEBI (Listing Obligations And Disclosure Requirements) Regulations 2015 And Opening Of Trading Window

13-Jul-2026 | Source : BSE

Transformers And Rectifiers (India) Ltdhas informed BSE that the meeting of the Board of Directors of the Company is scheduled on 20/07/2026 inter alia to consider and approve the Unaudited Standalone and Consolidated Financial Results of the Company for the quarter ended 30th June 2026 Further pursuant to the Companys Code of Conduct for Prevention of Insider Trading framed under the SEBI (Prohibition of Insider Trading) Regulations 2015 the Trading Window for dealing in the securities of the Company shall open with effect from 23rd July 2026 for all Designated Persons/Connected Persons their immediate relatives and other insiders covered under the said Regulations. Kindly take the above information on record.

Corporate Actions stock-summary

stock-summary
BOARD MEETING

No Upcoming Board Meetings

stock-summary
DIVIDEND

Transformers & Rectifiers India Ltd has declared 20% dividend, ex-date: 09 May 25

stock-summary
SPLITS

Transformers & Rectifiers India Ltd has announced 1:10 stock split, ex-date: 28 Sep 17

stock-summary
BONUS

Transformers & Rectifiers India Ltd has announced 1:1 bonus issue, ex-date: 14 Feb 25

stock-summary
RIGHTS

No Rights history available

stock-summaryKey Factors

Quality key factors stock-summary

Factor
Value
Sales Growth (5y)
27.59%
EBIT Growth (5y)
48.37%
EBIT to Interest (avg)
3.88
Debt to EBITDA (avg)
2.39
Net Debt to Equity (avg)
0.11
Sales to Capital Employed (avg)
1.55
Tax Ratio
25.40%
Dividend Payout Ratio
2.80%
Pledged Shares
21.84%
Institutional Holding
9.33%
ROCE (avg)
16.00%
ROE (avg)
11.33%

Valuation key factors

Factor
Value
P/E Ratio
37
Industry P/E
44
Price to Book Value
6.27
EV to EBIT
26.90
EV to EBITDA
24.88
EV to Capital Employed
5.75
EV to Sales
3.79
PEG Ratio
NA
Dividend Yield
NA
ROCE (Latest)
21.04%
ROE (Latest)
17.45%

Technicals key factors

Indicator
Weekly
Monthly
MACD
Bullish
Mildly Bearish
RSI
No Signal
No Signal
Bollinger Bands
Mildly Bullish
Bearish
Moving Averages
Mildly Bullish (Daily)
KST
Bullish
Mildly Bearish
Dow Theory
Mildly Bearish
No Trend
OBV
No Trend
Bullish
stock-summary Technical Indicator Scale: Bearish, Mildly Bearish, Sideways, Mildly Bullish, Bullish  Turned 
stock-summaryShareholding
Shareholding Snapshot : Jun 2026stock-summary
Shareholding Compare (%holding) stock-summary
Majority shareholders

Promoters

Pledged Promoter Holdings

21.8428

Mutual Funds

Held by 18 Schemes (1.28%)

FIIs

Held by 102 FIIs (7.8%)

Promoter with highest holding

Jitendra Ujamsi Mamtora (31.3%)

Highest Public shareholder

State Of Wisconsin Investment Board - Alliance Bernstein L.p. (1.22%)

Individual Investors Holdings

22.87%

stock-summaryFinancial
[
  {
    "link": "quarterly",
    "btn_text": "All Quarterly Results",
    "header": "Quarterly Results Snapshot (Consolidated) - Jun'26 - YoY",
    "rhs": [
      {
        "prefix": "Net Sales ",
        "suffix": "YoY Growth in quarter ended Jun 2026 is 8.13% vs 64.39% in Jun 2025",
        "dir": -1
      },
      {
        "prefix": "Consolidated Net Profit ",
        "suffix": "YoY Growth in quarter ended Jun 2026 is -8.66% vs 235.24% in Jun 2025",
        "dir": -1
      }
    ],
    "table": {
      "header": [
        "Jun'26",
        "Jun'25",
        "Change(%)"
      ],
      "body": [
        {
          "field": "Net Sales",
          "val1": "572.34",
          "val2": "529.33",
          "chgp": "8.13%",
          "chgp_class": "positive"
        },
        {
          "field": "Operating Profit (PBDIT) excl Other Income",
          "val1": "93.34",
          "val2": "88.19",
          "chgp": "5.84%",
          "chgp_class": "positive"
        },
        {
          "field": "Interest",
          "val1": "14.80",
          "val2": "10.47",
          "chgp": "41.36%",
          "chgp_class": "negative"
        },
        {
          "field": "Exceptional Items",
          "val1": "0.00",
          "val2": "0.00",
          "chgp": "",
          "chgp_class": "neutral"
        },
        {
          "field": "Consolidate Net Profit",
          "val1": "61.52",
          "val2": "67.35",
          "chgp": "-8.66%",
          "chgp_class": "negative"
        },
        {
          "field": "Operating Profit Margin (Excl OI)",
          "val1": "16.31%",
          "val2": "16.66%",
          "chgp": "-0.35%",
          "chgp_class": "negative"
        }
      ]
    }
  },
  {
    "link": "half-yearly",
    "btn_text": "All Half Yearly Results",
    "header": "Half Yearly Results Snapshot (Consolidated) - Sep'25",
    "rhs": [
      {
        "prefix": "Net Sales ",
        "suffix": " Growth in half year ended Sep 2025 is 26.27% vs 89.89% in Sep 2024",
        "dir": -1
      },
      {
        "prefix": "Consolidated Net Profit ",
        "suffix": " Growth in half year ended Sep 2025 is 54.97% vs 694.00% in Sep 2024",
        "dir": -1
      }
    ],
    "table": {
      "header": [
        "Sep'25",
        "Sep'24",
        "Change(%)"
      ],
      "body": [
        {
          "field": "Net Sales",
          "val1": "989.36",
          "val2": "783.54",
          "chgp": "26.27%",
          "chgp_class": "positive"
        },
        {
          "field": "Operating Profit (PBDIT) excl Other Income",
          "val1": "139.71",
          "val2": "111.39",
          "chgp": "25.42%",
          "chgp_class": "positive"
        },
        {
          "field": "Interest",
          "val1": "23.34",
          "val2": "22.14",
          "chgp": "5.42%",
          "chgp_class": "negative"
        },
        {
          "field": "Exceptional Items",
          "val1": "0.00",
          "val2": "0.00",
          "chgp": "",
          "chgp_class": "neutral"
        },
        {
          "field": "Consolidate Net Profit",
          "val1": "101.26",
          "val2": "65.34",
          "chgp": "54.97%",
          "chgp_class": "positive"
        },
        {
          "field": "Operating Profit Margin (Excl OI)",
          "val1": "14.12%",
          "val2": "14.22%",
          "chgp": "-0.10%",
          "chgp_class": "negative"
        }
      ]
    }
  },
  {
    "link": "nine-monthly",
    "btn_text": "All Nine Monthly Results",
    "header": "Nine Monthly Results Snapshot (Consolidated) - Dec'25",
    "rhs": [
      {
        "prefix": "Net Sales ",
        "suffix": "YoY Growth in nine months ended Dec 2025 is 28.54% vs 71.73% in Dec 2024",
        "dir": -1
      },
      {
        "prefix": "Consolidated Net Profit ",
        "suffix": "YoY Growth in nine months ended Dec 2025 is 45.82% vs 2,527.79% in Dec 2024",
        "dir": -1
      }
    ],
    "table": {
      "header": [
        "Dec'25",
        "Dec'24",
        "Change(%)"
      ],
      "body": [
        {
          "field": "Net Sales",
          "val1": "1,726.12",
          "val2": "1,342.90",
          "chgp": "28.54%",
          "chgp_class": "positive"
        },
        {
          "field": "Operating Profit (PBDIT) excl Other Income",
          "val1": "264.69",
          "val2": "196.20",
          "chgp": "34.91%",
          "chgp_class": "positive"
        },
        {
          "field": "Interest",
          "val1": "36.71",
          "val2": "35.68",
          "chgp": "2.89%",
          "chgp_class": "negative"
        },
        {
          "field": "Exceptional Items",
          "val1": "0.00",
          "val2": "0.00",
          "chgp": "",
          "chgp_class": "neutral"
        },
        {
          "field": "Consolidate Net Profit",
          "val1": "175.11",
          "val2": "120.09",
          "chgp": "45.82%",
          "chgp_class": "positive"
        },
        {
          "field": "Operating Profit Margin (Excl OI)",
          "val1": "15.33%",
          "val2": "14.61%",
          "chgp": "0.72%",
          "chgp_class": "positive"
        }
      ]
    }
  },
  {
    "link": "annual",
    "btn_text": "All Annual Results",
    "header": "Annual Results Snapshot (Consolidated) - Mar'26",
    "rhs": [
      {
        "prefix": "Net Sales ",
        "suffix": "YoY Growth in year ended Mar 2026 is 24.24% vs 55.98% in Mar 2025",
        "dir": -1
      },
      {
        "prefix": "Consolidated Net Profit ",
        "suffix": "YoY Growth in year ended Mar 2026 is 23.39% vs 381.51% in Mar 2025",
        "dir": -1
      }
    ],
    "table": {
      "header": [
        "Mar'26",
        "Mar'25",
        "Change(%)"
      ],
      "body": [
        {
          "field": "Net Sales",
          "val1": "2,508.80",
          "val2": "2,019.38",
          "chgp": "24.24%",
          "chgp_class": "positive"
        },
        {
          "field": "Operating Profit (PBDIT) excl Other Income",
          "val1": "383.18",
          "val2": "327.46",
          "chgp": "17.02%",
          "chgp_class": "positive"
        },
        {
          "field": "Interest",
          "val1": "51.08",
          "val2": "50.60",
          "chgp": "0.95%",
          "chgp_class": "negative"
        },
        {
          "field": "Exceptional Items",
          "val1": "0.00",
          "val2": "3.24",
          "chgp": "-100.00%",
          "chgp_class": "negative"
        },
        {
          "field": "Consolidate Net Profit",
          "val1": "264.39",
          "val2": "214.27",
          "chgp": "23.39%",
          "chgp_class": "positive"
        },
        {
          "field": "Operating Profit Margin (Excl OI)",
          "val1": "15.27%",
          "val2": "16.22%",
          "chgp": "-0.95%",
          "chgp_class": "negative"
        }
      ]
    }
  }
]

Quarterly Results Snapshot (Consolidated) - Jun'26 - YoYstock-summary

Jun'26
Jun'25
Change(%)
Net Sales
572.34
529.33
8.13%
Operating Profit (PBDIT) excl Other Income
93.34
88.19
5.84%
Interest
14.80
10.47
41.36%
Exceptional Items
0.00
0.00
Consolidate Net Profit
61.52
67.35
-8.66%
Operating Profit Margin (Excl OI)
16.31%
16.66%
-0.35%
Values in Rs Cr.
Direction Arrows
Net Sales

YoY Growth in quarter ended Jun 2026 is 8.13% vs 64.39% in Jun 2025

Direction Arrows
Consolidated Net Profit

YoY Growth in quarter ended Jun 2026 is -8.66% vs 235.24% in Jun 2025

Half Yearly Results Snapshot (Consolidated) - Sep'25stock-summary

Sep'25
Sep'24
Change(%)
Net Sales
989.36
783.54
26.27%
Operating Profit (PBDIT) excl Other Income
139.71
111.39
25.42%
Interest
23.34
22.14
5.42%
Exceptional Items
0.00
0.00
Consolidate Net Profit
101.26
65.34
54.97%
Operating Profit Margin (Excl OI)
14.12%
14.22%
-0.10%
Values in Rs Cr.
Direction Arrows
Net Sales

Growth in half year ended Sep 2025 is 26.27% vs 89.89% in Sep 2024

Direction Arrows
Consolidated Net Profit

Growth in half year ended Sep 2025 is 54.97% vs 694.00% in Sep 2024

Nine Monthly Results Snapshot (Consolidated) - Dec'25stock-summary

Dec'25
Dec'24
Change(%)
Net Sales
1,726.12
1,342.90
28.54%
Operating Profit (PBDIT) excl Other Income
264.69
196.20
34.91%
Interest
36.71
35.68
2.89%
Exceptional Items
0.00
0.00
Consolidate Net Profit
175.11
120.09
45.82%
Operating Profit Margin (Excl OI)
15.33%
14.61%
0.72%
Values in Rs Cr.
Direction Arrows
Net Sales

YoY Growth in nine months ended Dec 2025 is 28.54% vs 71.73% in Dec 2024

Direction Arrows
Consolidated Net Profit

YoY Growth in nine months ended Dec 2025 is 45.82% vs 2,527.79% in Dec 2024

Annual Results Snapshot (Consolidated) - Mar'26stock-summary

Mar'26
Mar'25
Change(%)
Net Sales
2,508.80
2,019.38
24.24%
Operating Profit (PBDIT) excl Other Income
383.18
327.46
17.02%
Interest
51.08
50.60
0.95%
Exceptional Items
0.00
3.24
-100.00%
Consolidate Net Profit
264.39
214.27
23.39%
Operating Profit Margin (Excl OI)
15.27%
16.22%
-0.95%
Values in Rs Cr.
Direction Arrows
Net Sales

YoY Growth in year ended Mar 2026 is 24.24% vs 55.98% in Mar 2025

Direction Arrows
Consolidated Net Profit

YoY Growth in year ended Mar 2026 is 23.39% vs 381.51% in Mar 2025

stock-summaryCompany CV
About Transformers & Rectifiers India Ltd stock-summary
stock-summary
Transformers & Rectifiers India Ltd
Small Cap
Heavy Electrical Equipment
Transformers & Rectifiers India Limited (TARIL) was originally incorporated on 11 July, 1994 as 'Triveni Electric Company Limited'. Mr. Jitendra U. Mamtora, Mrs. Karunaben J. Mamtora and Mr. Satyen J. Mamtora promoted the Company. In 1995, the Company's name was changed to 'Transformers and Rectifiers (India) Limited'. Currently, the company is having 2 manufacturing facilities situated at Changodar and Odhav situated in Ahmedabad.
Company Coordinates stock-summary
Company Details
427 P/3-4 & 431 P/1-2, Sarkhej Bavla Highway Sanand Ahmedabad Gujarat : 382213
stock-summary
Tel: 91-2717-661661
stock-summary
info@transformerindia.com
Registrar Details
Link Intime India Pvt Ltd, C-13 Pannalal Silk Compound, L B S Marg, Bhandup , Mumbai