Auto.Corp.of Goa

  • Market Cap: Micro Cap
  • Industry: Auto Components & Equipments
  • ISIN: INE451C01013
  • NSEID: ACGL
  • BSEID: 505036
INR
1,746.45
-17.55 (-0.99%)
BSENSE

Sep 18, 03:30 PM

BSE+NSE Vol: 367

  • Price Points
  • Score
  • Mojo Parameters
  • Total Return
  • News and Corporate Actions
  • Key factors
  • Shareholding
  • Financials
  • CompanyCV
stock-summaryPrice Point
High/Low

1Day

52 Week

Valuation
Technical
Day's Volume

CASH

367 (-14.45%) Volume

Shareholding (Jun 2026)

FII

0.01%

Held by 1 FIIs

DII

0.00%

Held by 0 DIIs

Promoter

48.98%

Why is Automobile Corporation Of Goa Ltd falling/rising?

06-Sep-2026

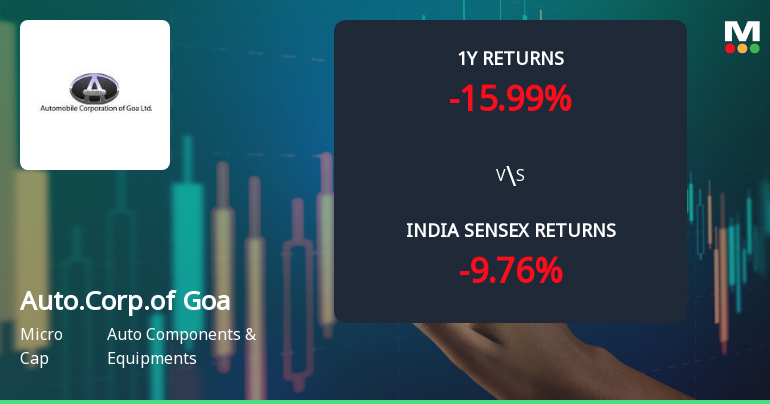
As of 05-Sep, the stock price of Automobile Corporation Of Goa Ltd is rising to 1,806.80, up 1.64%. Despite this recent increase, the stock has declined 15.25% over the past month and shows reduced investor participation, indicating potential long-term concerns.

As of 05-Sep, the stock price of Automobile Corporation Of Goa Ltd is rising, currently at 1,806.80, reflecting a change of 29.15 (1.64%) upward. This increase can be attributed to several factors. Firstly, the stock has outperformed the sector by 1.7% today and has shown consecutive gains over the last two days, with a total return of 2.48% during this period. Additionally, the stock's performance over the past week has been positive, with a gain of 1.20%, while the benchmark Sensex has declined by 0.97%. <BR><BR>However, it is important to note that despite the recent rise, the stock has experienced a significant decline over the past month, down 15.25%, and a year-over-year decrease of 10.92%. Moreover, there has been a notable drop in investor participation, with delivery volume falling by 48.75% against the 5-day average. This suggests that while the stock is currently rising, there are underlying concerns regarding its long-term performance and investor interest.

View full answer

Who are in the management team of Auto.Corp.of Goa?

01-Sep-2026

The management team of Auto.Corp.of Goa includes O V AJAY (CEO), Shrinivas V Dempo (Chairman), and several directors, both executive and independent, such as Vaijayanti Pandit and Yatin Kakodkar, along with Mitesh Gadhiya as Company Secretary. This diverse team provides a balance of leadership and oversight.

The management team of Auto.Corp.of Goa includes the following individuals:<BR><BR>1. **Vaijayanti Pandit** - Non-Executive & Independent Director<BR>2. **O V AJAY** - Executive Director & CEO<BR>3. **Shrinivas V Dempo** - Chairman & Independent Director<BR>4. **Yatin Kakodkar** - Non-Executive & Independent Director<BR>5. **Girish Wagh** - Non-Executive & Non-Independent Director<BR>6. **Rohit Srivastava** - Non-Executive & Non-Independent Director<BR>7. **Nagesh Dinkar Pinge** - Non-Executive & Independent Director<BR>8. **Vishal Badshah** - Director<BR>9. **Gopal Venkata Ramanan** - Director<BR>10. **Mitesh Gadhiya** - Company Secretary & Compliance Officer<BR><BR>This team brings a mix of executive and independent oversight to the company.

View full answer

What does Auto.Corp.of Goa do?

01-Sep-2026

Automobile Corporation of Goa Ltd. manufactures pressed parts and components for automobiles and is classified as a Micro Cap company. As of June 2026, it reported net sales of ₹246 Cr and a net profit of ₹11 Cr.

Overview:<BR>Automobile Corporation of Goa Ltd. is engaged in the manufacture of pressed parts, components, and sub-assemblies for various automobiles, operating within the Auto Components & Equipments industry and classified as a Micro Cap company.<BR><BR>History:<BR>The company was incorporated on 1 September 1980 as a Public Limited Company. It was jointly promoted by the Economic Development Corporation of Goa Limited and Tata Motors Limited. The latest quarterly results reported net sales and net profit for June 2026.<BR><BR>Financial Snapshot:<BR>- Net Sales: 246 Cr (Quarterly Results - Jun 2026)<BR>- Net Profit: 11 Cr (Quarterly Results - Jun 2026)<BR>- Market Cap: INR 1,087 Cr (Micro Cap)<BR><BR>Key Metrics:<BR>- P/E: 18.00<BR>- Industry P/E: 41<BR>- Dividend Yield: 1.54%<BR>- Debt Equity: -0.66<BR>- Return on Equity: 19.60%<BR>- Price to Book: 3.52<BR><BR>Contact Details:<BR>Address: Honda, Sattari Goa: 403530 <BR>Tel: 91-0832-6731111/6731215 <BR>Email: sectl@acglgoa.com <BR>Website: http://www.acglgoa.com

View full answer

Who are the peers of the Auto.Corp.of Goa?

01-Sep-2026

Peers of Auto.Corp.of Goa include Jay Bharat Maru, Igarashi Motors, Precision Camshf, Munjal Auto Inds, Alicon Cast., The Hi-Tech Gear, Saint-Gob. Sekur, Pradeep Metals, and Veljan Denison. Auto.Corp.of Goa has good growth and excellent capital structure, with a 1-year return of -11.95%, higher than Precision Camshf but lower than most peers.

Peers: The peers of Auto.Corp.of Goa are Jay Bharat Maru., Igarashi Motors, Precision Camshf, Munjal Auto Inds, Alicon Cast., The Hi-Tech Gear, Saint-Gob. Sekur, Pradeep Metals, and Veljan Denison.<BR><BR>Quality Snapshot: Excellent management risk is observed at Alicon Cast., while Average management risk is found at Jay Bharat Maru., Igarashi Motors, Precision Camshf, Munjal Auto Inds, Auto.Corp.of Goa, The Hi-Tech Gear, Saint-Gob. Sekur, Pradeep Metals, and Veljan Denison. Growth ratings show that Good growth is seen at Precision Camshf and Auto.Corp.of Goa, while Below Average growth is noted at Jay Bharat Maru., Igarashi Motors, Munjal Auto Inds, Alicon Cast., The Hi-Tech Gear, Saint-Gob. Sekur, Pradeep Metals, and Veljan Denison. In terms of Capital Structure, Excellent capital structure is noted at Auto.Corp.of Goa, Saint-Gob. Sekur, and Veljan Denison, while Average capital structure is found at Jay Bharat Maru., Igarashi Motors, Precision Camshf, Munjal Auto Inds, Alicon Cast., The Hi-Tech Gear, and Pradeep Metals.<BR><BR>Return Snapshot: The peer with the highest 1-year return is Pradeep Metals at 107.08%, while the lowest is Precision Camshf at -26.76%. Auto.Corp.of Goa's 1-year return of -11.95% is higher than Precision Camshf's but lower than the returns of most peers. Additionally, the six-month return is negative for Precision Camshf, Alicon Cast., and The Hi-Tech Gear.

View full answer

How big is Auto.Corp.of Goa?

01-Sep-2026

As of 31st August, Automobile Corporation Of Goa Ltd has a market capitalization of 1,087.00 Cr, with Net Sales of 914.46 Cr and a Net Profit of 58.04 Cr reported in the latest four quarters. Shareholder's Funds are 308.59 Cr and Total Assets are valued at 458.81 Cr as of March 2026.

As of 31st August, Automobile Corporation Of Goa Ltd has a market capitalization of 1,087.00 Cr, categorizing it as a Micro Cap company.<BR><BR>In the latest four quarters, the company reported Net Sales of 914.46 Cr and a Net Profit of 58.04 Cr.<BR><BR>For the latest reporting period in March 2026, the Shareholder's Funds amounted to 308.59 Cr, while Total Assets were valued at 458.81 Cr.

View full answer

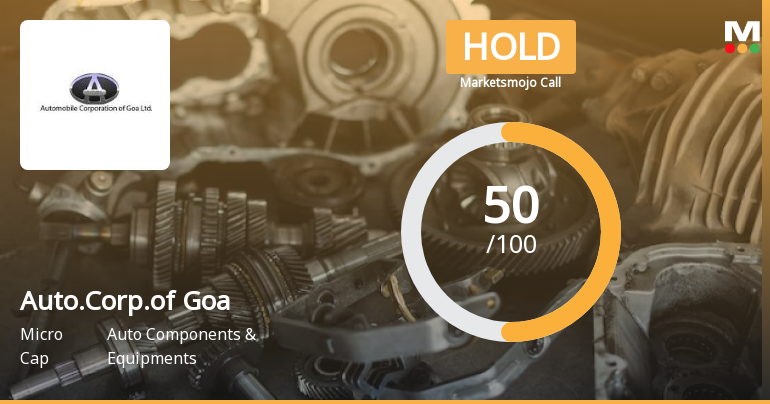
Should I buy, sell or hold Automobile Corporation Of Goa Ltd?

06-Aug-2026

Are Automobile Corporation Of Goa Ltd latest results good or bad?

06-May-2026

The latest results for Automobile Corporation Of Goa Ltd are positive, with a 33.52% increase in net sales and a 96.31% rise in net profit for Q4 FY26. However, concerns about margin volatility and reliance on Tata Motors as a primary customer warrant caution for future performance.

The latest results for Automobile Corporation Of Goa Ltd are quite positive overall. In the fourth quarter of FY26, the company reported a significant increase in net sales, which rose by 33.52% quarter-on-quarter to ₹265.27 crores. This growth is a strong indicator of demand recovery in the auto components sector. Additionally, net profit surged by an impressive 96.31% to ₹21.32 crores compared to the previous quarter.<BR><BR>Operating margins also improved, reaching 9.38%, which is a positive sign of operational efficiency. The company has maintained a zero-debt balance sheet, providing it with financial flexibility, and has shown consistent profitability over recent quarters.<BR><BR>However, it's worth noting that there are some concerns regarding margin volatility, as operating margins have fluctuated significantly in recent quarters. This raises questions about the sustainability of the current profitability levels. Additionally, the company's heavy reliance on Tata Motors as its primary customer introduces some concentration risk.<BR><BR>In summary, while the results indicate strong performance and growth, investors should remain cautious about the underlying margin pressures and operational challenges that could affect future performance.

View full answer

When is the next results date for Automobile Corporation Of Goa Ltd?

29-Apr-2026

The next results date for Automobile Corporation Of Goa Ltd is 05 May 2026.

The next results date for Automobile Corporation Of Goa Ltd is scheduled for 05 May 2026.

View full answer

Has Automobile Corporation Of Goa Ltd declared dividend?

20-Jan-2026

Yes, Automobile Corporation Of Goa Ltd has declared a 50% dividend, amounting to ₹5 per share, with an ex-date of January 29, 2026. The company has shown varying total returns across different periods, with significant growth of 281.44% over the last 5 years.

Automobile Corporation Of Goa Ltd has declared a 50% dividend.<BR><BR>Dividend Details:<BR>- Percentage announced: 50%<BR>- Amount per share: 5<BR>- Ex-date: 29 Jan 26<BR><BR>Dividend Yield: 0.27%.<BR><BR>Total Returns by Period:<BR>In the last 3 months, the company experienced a price return of -12.38%, a dividend return of 0.24%, resulting in a total return of -12.14%.<BR><BR>Over the past 6 months, there was a price return of 0.85%, a dividend return of 0.28%, leading to a total return of 1.13%.<BR><BR>In the last year, the price return was -9.41%, with a dividend return of 0.60%, culminating in a total return of -8.81%.<BR><BR>For the 2-year period, the company saw a price return of 24.12%, a dividend return of 1.79%, resulting in a total return of 25.91%.<BR><BR>In the last 3 years, there was a significant price return of 111.48%, a dividend return of 5.68%, leading to a total return of 117.16%.<BR><BR>Over the past 4 years, the price return was 83.37%, with a dividend return of 5.29%, resulting in a total return of 88.66%.<BR><BR>In the last 5 years, the company experienced a price return of 271.18%, a dividend return of 10.26%, leading to a total return of 281.44%.<BR><BR>Overall, the company has declared a dividend and has shown varying total returns across different periods, with significant growth in the longer term, particularly over the last 5 years.

View full answer

Is Auto.Corp.of Goa overvalued or undervalued?

05-Dec-2025

As of December 4, 2025, Auto.Corp.of Goa is assessed as fairly valued with a PE ratio of 18.98, lower than peers like Samvardhana Motherson and Bosch, indicating a potential undervaluation despite a recent 1-week stock return of 2.00%.

As of 4 December 2025, the valuation grade for Auto.Corp.of Goa has moved from very attractive to attractive, indicating a shift in its perceived value. The company is currently assessed as fairly valued. Key ratios include a PE ratio of 18.98, an EV to EBITDA of 16.07, and a PEG ratio of 0.67, which suggest that while the company is performing well, it may not present as significant an investment opportunity as previously thought.<BR><BR>In comparison to its peers, Auto.Corp.of Goa's PE ratio is notably lower than that of Samvardhana Motherson, which stands at 36.62, and Bosch, which is at 47.82, highlighting a potential undervaluation relative to these competitors. The company's recent stock performance has shown a 1-week return of 2.00%, contrasting with a slight decline in the Sensex, reinforcing its relative strength in the market. Overall, Auto.Corp.of Goa appears to be fairly valued within the current market context.

View full answer

How has been the historical performance of Auto.Corp.of Goa?

04-Dec-2025

Auto.Corp.of Goa has shown significant growth from March 2021 to March 2025, with net sales increasing from 111.62 Cr to 651.11 Cr, and a turnaround from losses to profits in operating profit, profit before tax, and profit after tax. Total assets rose from 259.60 Cr to 465.26 Cr, indicating a strong recovery and growth trajectory.

Answer:<BR>The historical performance of Auto.Corp.of Goa shows significant growth in various financial metrics over the years, particularly from March 2021 to March 2025.<BR><BR>Breakdown:<BR>Auto.Corp.of Goa has experienced a steady increase in net sales, rising from 111.62 Cr in March 2021 to 651.11 Cr in March 2025. Other operating income has fluctuated, peaking at 13.18 Cr in March 2024 before dropping to 9.65 Cr in March 2025. Total operating income has similarly grown, reaching 660.76 Cr in March 2025, up from just 115.70 Cr in March 2021. The raw material cost has also increased, from 75.98 Cr in March 2021 to 456.14 Cr in March 2025, contributing to total expenditure rising to 608.43 Cr in March 2025. Operating profit, excluding other income, improved from a loss of 21.50 Cr in March 2021 to a profit of 52.33 Cr in March 2025. Profit before tax has shown a positive trend, increasing from a loss of 16.30 Cr in March 2021 to 62.50 Cr in March 2025, while profit after tax has surged from a loss of 12.51 Cr in March 2021 to 46.60 Cr in March 2025. The earnings per share have also significantly improved, from -20.54 in March 2021 to 76.52 in March 2025. On the balance sheet, total assets increased from 259.60 Cr in March 2020 to 465.26 Cr in March 2025, with total liabilities rising from 231.16 Cr to 465.26 Cr during the same period. Cash flow from operating activities has shown variability, with a notable increase to 9.00 Cr in March 2025 from a negative cash flow in previous years. Overall, the financial performance of Auto.Corp.of Goa reflects a strong recovery and growth trajectory in recent years.

View full answer

Is Auto.Corp.of Goa technically bullish or bearish?

10-Nov-2025

As of November 7, 2025, the technical trend is mildly bearish, supported by bearish signals from MACD, KST, and Dow Theory indicators, despite a mildly bullish daily moving average, and the stock has underperformed compared to the Sensex over the past month and year.

As of 7 November 2025, the technical trend has changed from sideways to mildly bearish. The current stance is mildly bearish, driven by the weekly and monthly MACD, KST, and Dow Theory indicators all indicating a bearish outlook. The Bollinger Bands also confirm a bearish trend on both weekly and monthly time frames. Although the daily moving averages show a mildly bullish signal, the overall sentiment remains bearish due to the prevailing indicators. The stock has underperformed significantly compared to the Sensex over the past month and year, further supporting the bearish view.

View full answer

Who are the top shareholders of the Auto.Corp.of Goa?

06-Jun-2025

The top shareholders of Auto.Corp.of Goa are Tata Motors Limited with 48.98%, Edc Limited at 6.66%, and individual investors holding 32.68%. There are no pledged promoter holdings or mutual funds invested in the company, and foreign institutional investors hold 0.01%.

The top shareholders of Auto.Corp.of Goa include Tata Motors Limited, which holds the largest share at 48.98%. The highest public shareholder is Edc Limited, with a stake of 6.66%. Additionally, individual investors collectively own 32.68% of the company. There is also a small presence of foreign institutional investors, holding 0.01%. Notably, there are no pledged promoter holdings and no mutual funds currently invested in the company.

View full answer
iScoreScore
Click here to find our call on this stock
Strong Sell
Sell
Hold
Buy
Strong Buy

Dashboard

1

Company has a Debt to Equity ratio (avg) of 0.09 times

 
2

Healthy long term growth as Net Sales has grown by an annual rate of 45.02%

3

With ROE of 19.6, it has a Attractive valuation with a 3.4 Price to Book Value

4

Despite the size of the company, domestic mutual funds hold only 0% of the company

5

Below par performance in long term as well as near term

stock-summaryMojo Parameters

Mojo Parameters

Loading Valuation Snapshot...

Stock DNA

stock-summary
Industry

Auto Components & Equipments

stock-summary
Market cap

INR 1,079 Cr (Micro Cap)

stock-summary
P/E

18.00

stock-summary
Industry P/E

39

stock-summary
Dividend Yield

1.56%

stock-summary
Debt Equity

-0.66

stock-summary
Return on Equity

19.60%

stock-summary
Price to Book

3.48

Revenue and Profits:
Net Sales:
246 Cr
(Quarterly Results - Jun 2026)
Net Profit:
11 Cr
stock-summaryTotal Returns
Total Returns (Price + Dividend) stock-summary
Dividend Yield (1.56%)
TimePeriod
Price Return
Dividend Return
Total Return
3 Months
-16.56%
1.03%
-15.53%
6 Months
5.99%
1.42%
7.41%
1 Year
-21.81%
1.26%
-20.55%
2 Years
-34.62%
1.23%
-33.39%
3 Years
13.14%
3.49%
16.63%
4 Years
65.93%
7.06%
72.99%
5 Years
191.59%
9.76%
201.35%

Latest dividend: 22.5 per share ex-dividend date: Jul-15-2026

Risk Adjusted Returns v/s stock-summary
Returns Beta
Icon
Beta has not been calculated since enough price history is not available
stock-summaryNews & Corporate Actions

News

Announcements stock-summary

Announcement under Regulation 30 (LODR)-Newspaper Publication

06-Aug-2026 | Source : BSE

Pursuant to Regulation 30 and 47 of the SEBI (Listing Obligations and Disclosure Requirements) Regulations 2015 attached herewith the news paper advertisement on publication of Financial Results of the Company for the quarter ended June 30 2026 published on August 06 2026 in the Financial Express and Dainik Pudhari.

Results - Financial Results For June 30 2026

05-Aug-2026 | Source : BSE

Financials Results for June 30 2026

Board Meeting Outcome for Outcome Of The Board Meeting

05-Aug-2026 | Source : BSE

Outcome of the Board Meeting

Corporate Actions stock-summary

stock-summary
BOARD MEETING

No Upcoming Board Meetings

stock-summary
DIVIDEND

Automobile Corporation Of Goa Ltd has declared 225% dividend, ex-date: 15 Jul 26

stock-summary
SPLITS

No Splits history available

stock-summary
BONUS

No Bonus history available

stock-summary
RIGHTS

Automobile Corporation Of Goa Ltd has announced 3:10 rights issue, ex-date: 21 Feb 07

stock-summaryKey Factors

Quality key factors stock-summary

Factor
Value
Sales Growth (5y)
45.02%
EBIT Growth (5y)
36.80%
EBIT to Interest (avg)
42.41
Debt to EBITDA (avg)
1.30
Net Debt to Equity (avg)
-0.66
Sales to Capital Employed (avg)
1.74
Tax Ratio
26.01%
Dividend Payout Ratio
32.66%
Pledged Shares
0
Institutional Holding
0.01%
ROCE (avg)
10.50%
ROE (avg)
15.58%

Valuation key factors

Factor
Value
P/E Ratio
18
Industry P/E
39
Price to Book Value
3.45
EV to EBIT
13.23
EV to EBITDA
12.10
EV to Capital Employed
8.25
EV to Sales
0.93
PEG Ratio
1.04
Dividend Yield
1.57%
ROCE (Latest)
61.41%
ROE (Latest)
19.60%

Technicals key factors

Indicator
Weekly
Monthly
MACD
Bearish
Bullish
RSI
No Signal
No Signal
Bollinger Bands
Bearish
Bearish
Moving Averages
Mildly Bullish (Daily)
KST
Mildly Bearish
Bullish
Dow Theory
Mildly Bearish
Mildly Bearish
OBV
No Trend
No Trend
stock-summary Technical Indicator Scale: Bearish, Mildly Bearish, Sideways, Mildly Bullish, Bullish  Turned 
stock-summaryShareholding
Shareholding Snapshot : Jun 2026stock-summary
Shareholding Compare (%holding) stock-summary
Majority shareholders

Non Institution

Pledged Promoter Holdings

None

Mutual Funds

Held by 0 Schemes

FIIs

Held by 1 FIIs (0.01%)

Promoter with highest holding

Tata Motors Limited (48.98%)

Highest Public shareholder

Edc Limited (6.66%)

Individual Investors Holdings

33.15%

stock-summaryFinancial
[
  {
    "link": "quarterly",
    "btn_text": "All Quarterly Results",
    "header": "Quarterly Results Snapshot (Standalone) - Jun'26 - QoQ",
    "rhs": [
      {
        "prefix": "Net Sales ",
        "suffix": "QoQ Growth in quarter ended Jun 2026 is -7.42% vs 33.52% in Mar 2026",
        "dir": -1
      },
      {
        "prefix": "Standalone Net Profit ",
        "suffix": "QoQ Growth in quarter ended Jun 2026 is -47.37% vs 96.32% in Mar 2026",
        "dir": -1
      }
    ],
    "table": {
      "header": [
        "Jun'26",
        "Mar'26",
        "Change(%)"
      ],
      "body": [
        {
          "field": "Net Sales",
          "val1": "245.59",
          "val2": "265.27",
          "chgp": "-7.42%",
          "chgp_class": "negative"
        },
        {
          "field": "Operating Profit (PBDIT) excl Other Income",
          "val1": "13.14",
          "val2": "24.87",
          "chgp": "-47.17%",
          "chgp_class": "negative"
        },
        {
          "field": "Interest",
          "val1": "0.03",
          "val2": "0.03",
          "chgp": "",
          "chgp_class": "neutral"
        },
        {
          "field": "Exceptional Items",
          "val1": "0.00",
          "val2": "0.00",
          "chgp": "",
          "chgp_class": "neutral"
        },
        {
          "field": "Standalone Net Profit",
          "val1": "11.22",
          "val2": "21.32",
          "chgp": "-47.37%",
          "chgp_class": "negative"
        },
        {
          "field": "Operating Profit Margin (Excl OI)",
          "val1": "5.35%",
          "val2": "9.38%",
          "chgp": "-4.03%",
          "chgp_class": "negative"
        }
      ]
    }
  },
  {
    "link": "half-yearly",
    "btn_text": "All Half Yearly Results",
    "header": "Half Yearly Results Snapshot (Standalone) - Sep'25",
    "rhs": [
      {
        "prefix": "Net Sales ",
        "suffix": " Growth in half year ended Sep 2025 is 39.19% vs 22.25% in Sep 2024",
        "dir": 1
      },
      {
        "prefix": "Standalone Net Profit ",
        "suffix": " Growth in half year ended Sep 2025 is 49.29% vs 42.87% in Sep 2024",
        "dir": 1
      }
    ],
    "table": {
      "header": [
        "Sep'25",
        "Sep'24",
        "Change(%)"
      ],
      "body": [
        {
          "field": "Net Sales",
          "val1": "453.34",
          "val2": "325.71",
          "chgp": "39.19%",
          "chgp_class": "positive"
        },
        {
          "field": "Operating Profit (PBDIT) excl Other Income",
          "val1": "44.91",
          "val2": "28.26",
          "chgp": "58.92%",
          "chgp_class": "positive"
        },
        {
          "field": "Interest",
          "val1": "0.06",
          "val2": "0.04",
          "chgp": "50.00%",
          "chgp_class": "negative"
        },
        {
          "field": "Exceptional Items",
          "val1": "0.00",
          "val2": "0.00",
          "chgp": "",
          "chgp_class": "neutral"
        },
        {
          "field": "Standalone Net Profit",
          "val1": "37.71",
          "val2": "25.26",
          "chgp": "49.29%",
          "chgp_class": "positive"
        },
        {
          "field": "Operating Profit Margin (Excl OI)",
          "val1": "9.91%",
          "val2": "8.68%",
          "chgp": "1.23%",
          "chgp_class": "positive"
        }
      ]
    }
  },
  {
    "link": "nine-monthly",
    "btn_text": "All Nine Monthly Results",
    "header": "Nine Monthly Results Snapshot (Standalone) - Dec'25",
    "rhs": [
      {
        "prefix": "Net Sales ",
        "suffix": "YoY Growth in nine months ended Dec 2025 is 49.77% vs 8.10% in Dec 2024",
        "dir": 1
      },
      {
        "prefix": "Standalone Net Profit ",
        "suffix": "YoY Growth in nine months ended Dec 2025 is 63.15% vs 8.41% in Dec 2024",
        "dir": 1
      }
    ],
    "table": {
      "header": [
        "Dec'25",
        "Dec'24",
        "Change(%)"
      ],
      "body": [
        {
          "field": "Net Sales",
          "val1": "652.01",
          "val2": "435.35",
          "chgp": "49.77%",
          "chgp_class": "positive"
        },
        {
          "field": "Operating Profit (PBDIT) excl Other Income",
          "val1": "60.84",
          "val2": "32.35",
          "chgp": "88.07%",
          "chgp_class": "positive"
        },
        {
          "field": "Interest",
          "val1": "0.10",
          "val2": "0.07",
          "chgp": "42.86%",
          "chgp_class": "negative"
        },
        {
          "field": "Exceptional Items",
          "val1": "-3.29",
          "val2": "0.00",
          "chgp": "",
          "chgp_class": "neutral"
        },
        {
          "field": "Standalone Net Profit",
          "val1": "48.57",
          "val2": "29.77",
          "chgp": "63.15%",
          "chgp_class": "positive"
        },
        {
          "field": "Operating Profit Margin (Excl OI)",
          "val1": "9.18%",
          "val2": "7.29%",
          "chgp": "1.89%",
          "chgp_class": "positive"
        }
      ]
    }
  },
  {
    "link": "annual",
    "btn_text": "All Annual Results",
    "header": "Annual Results Snapshot (Standalone) - Mar'26",
    "rhs": [
      {
        "prefix": "Net Sales ",
        "suffix": "YoY Growth in year ended Mar 2026 is 40.88% vs 14.00% in Mar 2025",
        "dir": 1
      },
      {
        "prefix": "Standalone Net Profit ",
        "suffix": "YoY Growth in year ended Mar 2026 is 49.98% vs 21.45% in Mar 2025",
        "dir": 1
      }
    ],
    "table": {
      "header": [
        "Mar'26",
        "Mar'25",
        "Change(%)"
      ],
      "body": [
        {
          "field": "Net Sales",
          "val1": "917.27",
          "val2": "651.11",
          "chgp": "40.88%",
          "chgp_class": "positive"
        },
        {
          "field": "Operating Profit (PBDIT) excl Other Income",
          "val1": "85.72",
          "val2": "52.33",
          "chgp": "63.81%",
          "chgp_class": "positive"
        },
        {
          "field": "Interest",
          "val1": "0.13",
          "val2": "0.09",
          "chgp": "44.44%",
          "chgp_class": "negative"
        },
        {
          "field": "Exceptional Items",
          "val1": "-3.29",
          "val2": "0.00",
          "chgp": "",
          "chgp_class": "neutral"
        },
        {
          "field": "Standalone Net Profit",
          "val1": "69.89",
          "val2": "46.60",
          "chgp": "49.98%",
          "chgp_class": "positive"
        },
        {
          "field": "Operating Profit Margin (Excl OI)",
          "val1": "9.35%",
          "val2": "8.04%",
          "chgp": "1.31%",
          "chgp_class": "positive"
        }
      ]
    }
  }
]

Quarterly Results Snapshot (Standalone) - Jun'26 - QoQstock-summary

Jun'26
Mar'26
Change(%)
Net Sales
245.59
265.27
-7.42%
Operating Profit (PBDIT) excl Other Income
13.14
24.87
-47.17%
Interest
0.03
0.03
Exceptional Items
0.00
0.00
Standalone Net Profit
11.22
21.32
-47.37%
Operating Profit Margin (Excl OI)
5.35%
9.38%
-4.03%
Values in Rs Cr.
Direction Arrows
Net Sales

QoQ Growth in quarter ended Jun 2026 is -7.42% vs 33.52% in Mar 2026

Direction Arrows
Standalone Net Profit

QoQ Growth in quarter ended Jun 2026 is -47.37% vs 96.32% in Mar 2026

Half Yearly Results Snapshot (Standalone) - Sep'25stock-summary

Sep'25
Sep'24
Change(%)
Net Sales
453.34
325.71
39.19%
Operating Profit (PBDIT) excl Other Income
44.91
28.26
58.92%
Interest
0.06
0.04
50.00%
Exceptional Items
0.00
0.00
Standalone Net Profit
37.71
25.26
49.29%
Operating Profit Margin (Excl OI)
9.91%
8.68%
1.23%
Values in Rs Cr.
Direction Arrows
Net Sales

Growth in half year ended Sep 2025 is 39.19% vs 22.25% in Sep 2024

Direction Arrows
Standalone Net Profit

Growth in half year ended Sep 2025 is 49.29% vs 42.87% in Sep 2024

Nine Monthly Results Snapshot (Standalone) - Dec'25stock-summary

Dec'25
Dec'24
Change(%)
Net Sales
652.01
435.35
49.77%
Operating Profit (PBDIT) excl Other Income
60.84
32.35
88.07%
Interest
0.10
0.07
42.86%
Exceptional Items
-3.29
0.00
Standalone Net Profit
48.57
29.77
63.15%
Operating Profit Margin (Excl OI)
9.18%
7.29%
1.89%
Values in Rs Cr.
Direction Arrows
Net Sales

YoY Growth in nine months ended Dec 2025 is 49.77% vs 8.10% in Dec 2024

Direction Arrows
Standalone Net Profit

YoY Growth in nine months ended Dec 2025 is 63.15% vs 8.41% in Dec 2024

Annual Results Snapshot (Standalone) - Mar'26stock-summary

Mar'26
Mar'25
Change(%)
Net Sales
917.27
651.11
40.88%
Operating Profit (PBDIT) excl Other Income
85.72
52.33
63.81%
Interest
0.13
0.09
44.44%
Exceptional Items
-3.29
0.00
Standalone Net Profit
69.89
46.60
49.98%
Operating Profit Margin (Excl OI)
9.35%
8.04%
1.31%
Values in Rs Cr.
Direction Arrows
Net Sales

YoY Growth in year ended Mar 2026 is 40.88% vs 14.00% in Mar 2025

Direction Arrows
Standalone Net Profit

YoY Growth in year ended Mar 2026 is 49.98% vs 21.45% in Mar 2025

stock-summaryCompany CV
About Automobile Corporation Of Goa Ltd stock-summary
stock-summary
Automobile Corporation Of Goa Ltd
Micro Cap
Auto Components & Equipments
Automobile Corporation of Goa Ltd. (ACGL) was incorporated on 1 September 1980 as a Public Limited Company. The Company was jointly promoted by Economic Development Corporation of Goa Limited (EDC) a Government of Goa Undertaking) and Tata Motors Limited. The Company is engaged in the manufacture of pressed parts, components, sub assemblies for various range of automobiles and manufacture Bus bodies and components thereof.
Company Coordinates stock-summary
Company Details
Honda , Sattari Goa : 403530
stock-summary
Tel: 91-0832-6731111/6731215
stock-summary
sectl@acglgoa.com
Registrar Details
TSR Darashaw Ltd, 6-10 , Haji Moosa Patrawala Indl. Est , 20 Dr.E.Moses Road , Mahalaxmi , Mumbai