
Compare Autoline Industr with Similar Stocks
Dashboard
Low ability to service debt as the company has a high Debt to EBITDA ratio of 4.12 times
- Low ability to service debt as the company has a high Debt to EBITDA ratio of 4.12 times
- The company has been able to generate a Return on Equity (avg) of 9.18% signifying low profitability per unit of shareholders funds
Healthy long term growth as Operating profit has grown by an annual rate 46.67%
With a growth in Net Profit of 529.61%, the company declared Very Positive results in Mar 26
With ROCE of 11.1, it has a Attractive valuation with a 1.3 Enterprise value to Capital Employed
Falling Participation by Institutional Investors
Stock DNA
Auto Components & Equipments
INR 334 Cr (Micro Cap)
15.00
24
0.00%
1.60
11.41%
1.70
Total Returns (Price + Dividend) 
Latest dividend: 1 per share ex-dividend date: Sep-19-2013
Risk Adjusted Returns v/s
Returns Beta

News
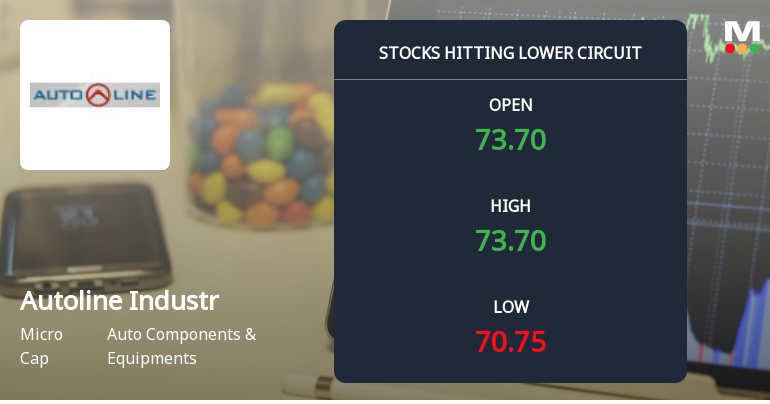
Autoline Industries Ltd Locks at Lower Circuit With 5% Loss — Sellers Queue, No Buyers in Sight
At Rs 69.99, sellers were still queuing — but there were no buyers willing to take the other side. Autoline Industries Ltd locked at its lower circuit of 5% on 11 Jun 2026, with unfilled sell orders and a frozen price, signalling a pronounced imbalance between supply and demand.
Read full news article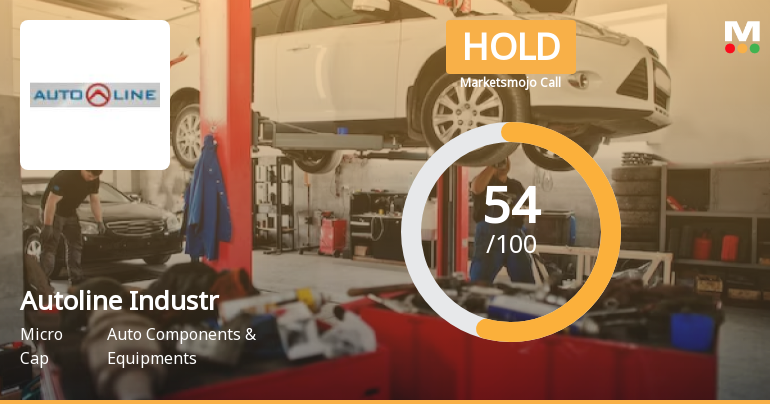
Autoline Industries Ltd Downgraded to Hold Amid Mixed Technical and Financial Signals
Autoline Industries Ltd, a micro-cap player in the Auto Components & Equipments sector, has seen its investment rating downgraded from Buy to Hold as of 8 June 2026. This revision reflects a nuanced assessment across four key parameters: quality, valuation, financial trend, and technical indicators. Despite strong quarterly financial results, evolving technical signals and valuation considerations have tempered investor enthusiasm.
Read full news article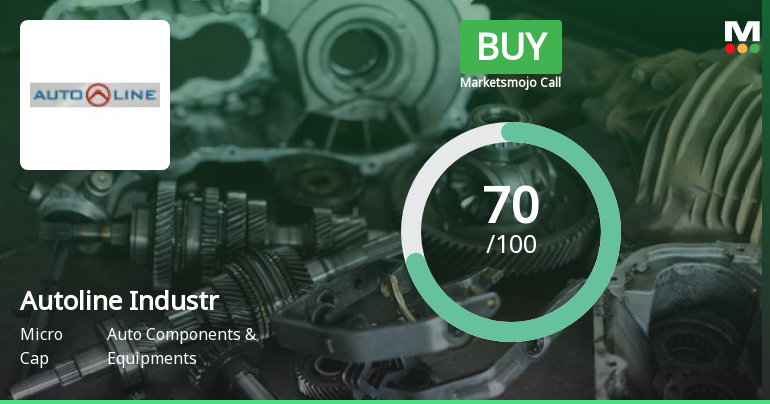
Autoline Industries Ltd Upgraded to Buy on Strong Financial and Technical Improvements
Autoline Industries Ltd has seen its investment rating upgraded from Hold to Buy, driven by a combination of improved technical indicators, robust financial performance, attractive valuation metrics, and a solid quality assessment. This upgrade reflects growing investor confidence amid a challenging market backdrop and highlights the company’s potential for sustainable growth in the auto components sector.
Read full news article Announcements
Compliances-Reg.24(A)-Annual Secretarial Compliance
29-May-2026 | Source : BSEAnnual Secretarial Compliance Report for the year ended March 31 2026.
Scheme Of Amalgamation
20-May-2026 | Source : BSEScheme of Amalgamation between Autoline Industries Limited and its wholly owned subsidiary namely Autoline Design Software Limited.
Announcement under Regulation 30 (LODR)-Investor Presentation
20-May-2026 | Source : BSEInvestor Presentation on Financial Results for the year ended March 31 2026.
Corporate Actions

No Upcoming Board Meetings

Autoline Industries Ltd has declared 10% dividend, ex-date: 19 Sep 13

No Splits history available

No Bonus history available

No Rights history available
Quality key factors
Valuation key factors
Technicals key factors
 Technical Indicator Scale: Bearish, Mildly Bearish, Sideways, Mildly Bullish, Bullish Turned
 Shareholding Snapshot : Mar 2026
Shareholding Compare (%holding)
Non Institution
None
Held by 0 Schemes
Held by 2 FIIs (0.34%)
Shivaji Tukaram Akhade (15.32%)
Sharjah Cement & Industrial Development Co (7.19%)
37.44%
Quarterly Results Snapshot (Consolidated) - Mar'26 - QoQ

QoQ Growth in quarter ended Mar 2026 is 38.12% vs 20.86% in Dec 2025
QoQ Growth in quarter ended Mar 2026 is 529.61% vs 73.74% in Dec 2025
Half Yearly Results Snapshot (Consolidated) - Sep'25
Growth in half year ended Sep 2025 is 5.79% vs -1.12% in Sep 2024

Growth in half year ended Sep 2025 is -68.00% vs 108.94% in Sep 2024
Nine Monthly Results Snapshot (Consolidated) - Dec'25
YoY Growth in nine months ended Dec 2025 is 15.36% vs -0.25% in Dec 2024
YoY Growth in nine months ended Dec 2025 is -28.14% vs 22.96% in Dec 2024
Annual Results Snapshot (Consolidated) - Mar'26
YoY Growth in year ended Mar 2026 is 25.13% vs 0.67% in Mar 2025
YoY Growth in year ended Mar 2026 is 116.05% vs 12.43% in Mar 2025
About Autoline Industries Ltd

Company Coordinates


