
Compare Avantel with Similar Stocks
Stock DNA
Aerospace & Defense
INR 4,524 Cr (Small Cap)
304.00
34
0.12%
0.07
4.44%
13.50
Total Returns (Price + Dividend) 
Latest dividend: 0.20072289156626505 per share ex-dividend date: Jun-12-2026
Risk Adjusted Returns v/s
Returns Beta

News
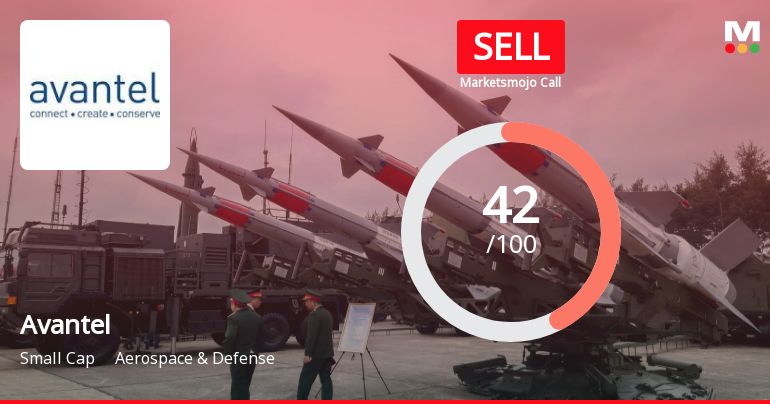
Avantel Ltd Upgraded to Sell by MarketsMOJO Amid Mixed Financial and Technical Signals
Avantel Ltd’s investment rating has been upgraded from Strong Sell to Sell, reflecting a nuanced shift driven primarily by technical indicators, despite ongoing financial headwinds. The company’s quality, valuation, financial trend, and technical parameters have been carefully analysed to justify this change, offering investors a comprehensive view of its current standing in the Aerospace & Defense sector.
Read full news article
Avantel Ltd Technical Momentum Shifts Amid Mixed Indicator Signals
Avantel Ltd, a small-cap player in the Aerospace & Defense sector, has experienced a nuanced shift in its technical momentum, moving from a bullish to a mildly bullish stance. Despite a day-on-day price decline of 2.14%, the stock’s broader technical indicators reveal a complex interplay of bullish and bearish signals, warranting a detailed analysis for investors seeking clarity on its near-term trajectory.
Read full news article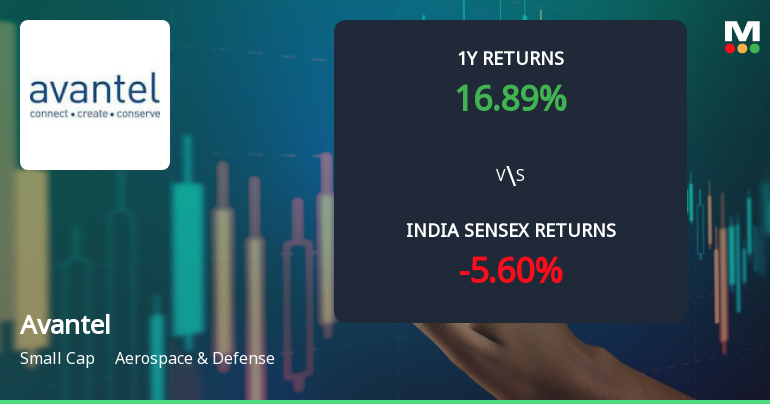
Avantel Ltd Technical Momentum Shifts Signal Bullish Outlook Amid Strong Long-Term Returns
Avantel Ltd has exhibited a notable shift in its technical momentum, transitioning from a mildly bullish to a bullish trend, supported by a blend of positive and mixed signals across key indicators such as MACD, RSI, Bollinger Bands, and moving averages. Despite a strong Mojo Grade downgrade to Strong Sell, the stock’s price action and momentum metrics suggest a nuanced outlook for investors in the aerospace and defence sector.
Read full news article Announcements
Announcement under Regulation 30 (LODR)-Award_of_Order_Receipt_of_Order
08-Jun-2026 | Source : BSEReceipt of Contract from DRDO worth of Rs.9.94 Cr
Announcement Under Regulation 30 - Letters Sent To Shareholders
01-Jun-2026 | Source : BSEEnclosed
Announcement under Regulation 30 (LODR)-Newspaper Publication
01-Jun-2026 | Source : BSENewspaper Publication of AGM Notice
Corporate Actions

No Upcoming Board Meetings

Avantel Ltd has declared 10% dividend, ex-date: 12 Jun 26

Avantel Ltd has announced 2:10 stock split, ex-date: 14 Aug 23

Avantel Ltd has announced 2:1 bonus issue, ex-date: 24 Nov 23

Avantel Ltd has announced 10:121 rights issue, ex-date: 07 May 25
Quality key factors
Valuation key factors
Technicals key factors
 Technical Indicator Scale: Bearish, Mildly Bearish, Sideways, Mildly Bullish, Bullish Turned
 Shareholding Snapshot : Mar 2026
Shareholding Compare (%holding)
Non Institution
None
Held by 0 Schemes
Held by 34 FIIs (0.55%)
Vidyasagar Abburi (16.93%)
K.swapna (2.4%)
51.14%
Quarterly Results Snapshot (Consolidated) - Mar'26 - QoQ

QoQ Growth in quarter ended Mar 2026 is 23.41% vs -6.68% in Dec 2025
QoQ Growth in quarter ended Mar 2026 is 74.09% vs -35.83% in Dec 2025
Half Yearly Results Snapshot (Consolidated) - Sep'25

Growth in half year ended Sep 2025 is -16.91% vs 4.79% in Sep 2024
Growth in half year ended Sep 2025 is -75.23% vs 25.75% in Sep 2024
Nine Monthly Results Snapshot (Consolidated) - Dec'25
YoY Growth in nine months ended Dec 2025 is -20.42% vs 9.45% in Dec 2024
YoY Growth in nine months ended Dec 2025 is -79.67% vs 24.65% in Dec 2024
Annual Results Snapshot (Consolidated) - Mar'26
YoY Growth in year ended Mar 2026 is -10.54% vs 11.04% in Mar 2025
YoY Growth in year ended Mar 2026 is -73.44% vs 7.40% in Mar 2025
About Avantel Ltd

Company Coordinates


