
Compare Avenue Super. with Similar Stocks
Stock DNA
Diversified Retail
INR 264,160 Cr (Large Cap)
86.00
71
0.00%
0.09
12.14%
10.72
Total Returns (Price + Dividend) 
Avenue Super. for the last several years.
Risk Adjusted Returns v/s
Returns Beta

News
Avenue Supermarts Ltd Sees Sharp Value Turnover Amid Declining Momentum
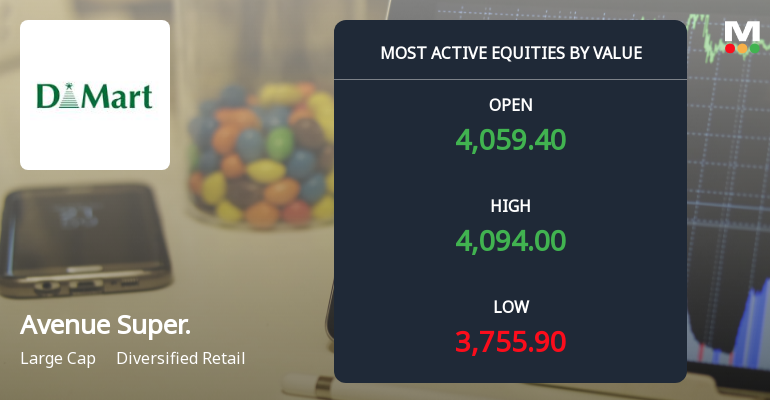
Avenue Supermarts Ltd (DMART), a leading player in the diversified retail sector, witnessed significant value-based trading on 28 Jul 2026, despite a sharp intraday decline. The stock’s performance today reflected heightened volatility and institutional caution, with the company’s Mojo Grade downgraded to Sell from Hold just two weeks prior, signalling a shift in market sentiment.
Read full news article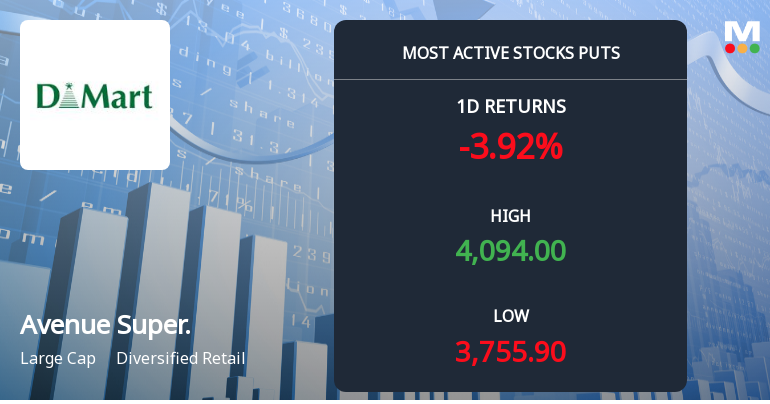
Rs 3,700 Puts — 3.3% Below Current Price — Draw 6,167 Contracts on Avenue Supermarts Ltd
The stock is down 4.13% today, yet 6,167 put contracts at the Rs 3,700 strike traded heavily on 28 Jul 2026, a strike 3.3% below the current price of Rs 3,825. This activity suggests a nuanced picture where protective hedging and bearish positioning both merit consideration.
Read full news article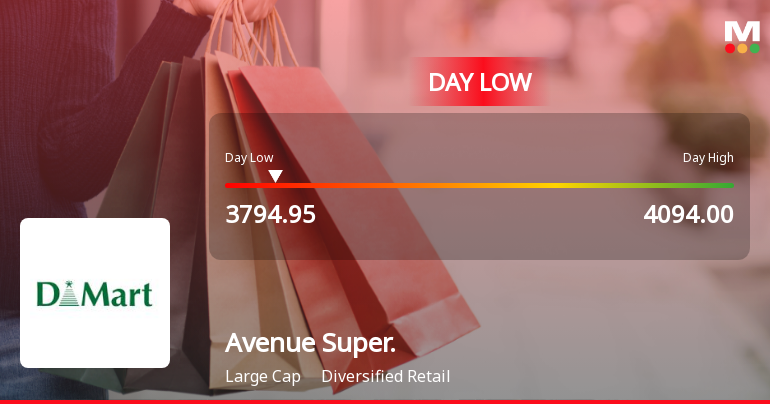
Avenue Supermarts Ltd Hits Intraday Low Amid Price Pressure on 28 Jul 2026
Avenue Supermarts Ltd experienced a notable decline today, touching an intraday low of Rs 3,794.95, reflecting a 5.63% drop as the stock underperformed both its sector and the broader market amid persistent selling pressure.
Read full news article Announcements
Disclosure Under Regulation 30 Of SEBI (Listing Obligation And Disclosure Requirements) Regulations 2015
24-Jul-2026 | Source : BSEDisclosure under Regulation 30 of SEBI (LODR) Regulation 2015
Announcement under Regulation 30 (LODR)-Newspaper Publication
24-Jul-2026 | Source : BSENewspaper Advertisement with respect to 26th Annual General Meeting and e-voting information
Announcement under Regulation 30 (LODR)-Investor Presentation
24-Jul-2026 | Source : BSEPresentation for Analyst / Investor Meet 2026
Corporate Actions

No Upcoming Board Meetings

No Dividend history available

No Splits history available

No Bonus history available

No Rights history available
Quality key factors
Valuation key factors
Technicals key factors
 Technical Indicator Scale: Bearish, Mildly Bearish, Sideways, Mildly Bullish, Bullish Turned
 Shareholding Snapshot : Jun 2026
Shareholding Compare (%holding)
Promoters
None
Held by 36 Schemes (6.64%)
Held by 621 FIIs (9.23%)
Radhakishan Shivkishan Damani (22.98%)
Icici Prudential Fund (2.64%)
6.42%
Quarterly Results Snapshot (Consolidated) - Jun'26 - YoY

YoY Growth in quarter ended Jun 2026 is 14.88% vs 16.28% in Jun 2025

YoY Growth in quarter ended Jun 2026 is 11.34% vs -0.11% in Jun 2025
Half Yearly Results Snapshot (Consolidated) - Sep'25
Growth in half year ended Sep 2025 is 15.86% vs 16.43% in Sep 2024
Growth in half year ended Sep 2025 is 1.71% vs 11.78% in Sep 2024
Nine Monthly Results Snapshot (Consolidated) - Dec'25
YoY Growth in nine months ended Dec 2025 is 14.95% vs 16.88% in Dec 2024
YoY Growth in nine months ended Dec 2025 is 7.27% vs 9.34% in Dec 2024
Annual Results Snapshot (Consolidated) - Mar'26
YoY Growth in year ended Mar 2026 is 15.94% vs 16.87% in Mar 2025
YoY Growth in year ended Mar 2026 is 9.69% vs 6.78% in Mar 2025
About Avenue Supermarts Ltd

Company Coordinates


