
Compare V-Mart Retail with Similar Stocks
Dashboard
Low ability to service debt as the company has a high Debt to EBITDA ratio of 1.83 times
- Low ability to service debt as the company has a high Debt to EBITDA ratio of 1.83 times
- The company has been able to generate a Return on Equity (avg) of 3.82% signifying low profitability per unit of shareholders funds
Healthy long term growth as Net Sales has grown by an annual rate of 28.65% and Operating profit at 50.27%
The company has declared Positive results for the last 6 consecutive quarters
With ROCE of 11.2, it has a Very Attractive valuation with a 4.4 Enterprise value to Capital Employed
High Institutional Holdings at 48.78%
Stock DNA
Diversified Retail
INR 6,231 Cr (Small Cap)
51.00
77
0.00%
0.91
14.76%
7.37
Total Returns (Price + Dividend) 
Latest dividend: 0.17500000000000002 per share ex-dividend date: Aug-18-2022
Risk Adjusted Returns v/s
Returns Beta

News

V-Mart Retail Ltd. is Rated Hold by MarketsMOJO
V-Mart Retail Ltd. is rated 'Hold' by MarketsMOJO, a rating that was last updated on 01 April 2026. While this rating change occurred in early April, the analysis and financial metrics discussed here reflect the stock's current position as of 19 June 2026, providing investors with an up-to-date perspective on the company’s fundamentals, valuation, financial trends, and technical outlook.
Read full news article
V-Mart Retail Ltd. Technical Momentum Shifts Signal Mildly Bullish Outlook
V-Mart Retail Ltd., a small-cap player in the diversified retail sector, has recently exhibited a shift in its technical momentum, moving from a sideways trend to a mildly bullish stance. Despite some conflicting signals from key technical indicators, the stock’s recent price action and relative strength suggest cautious optimism among investors.
Read full news article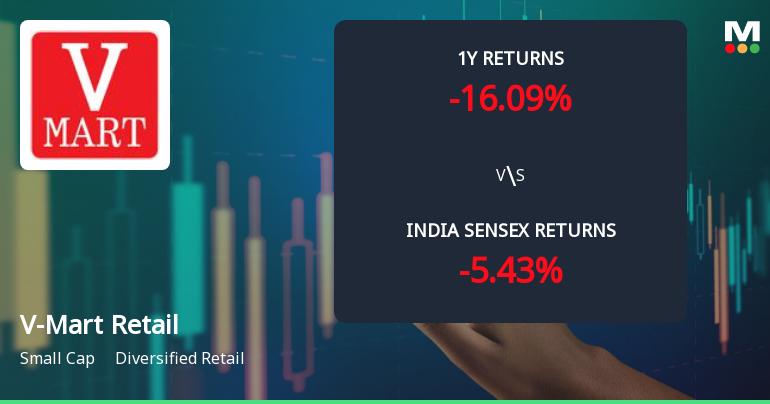
V-Mart Retail Ltd. Technical Momentum Shifts Signal Mixed Outlook Amid Price Rally
V-Mart Retail Ltd., a small-cap player in the diversified retail sector, has recently exhibited a notable shift in price momentum and technical indicators, signalling a complex market stance. After upgrading its Mojo Grade from Sell to Hold on 1 April 2026, the stock has gained 4.13% in a single day, reflecting renewed investor interest amid mixed technical trends.
Read full news article Announcements
Announcement under Regulation 30 (LODR)-Change in Management
10-Jun-2026 | Source : BSEResignation of Senior Management Personnel
Announcement under Regulation 30 (LODR)-Credit Rating
02-Jun-2026 | Source : BSECredit rating reaffirmed by ICRA
Announcement under Regulation 30 (LODR)-Newspaper Publication
21-May-2026 | Source : BSENotice for transfer of equity shares of the Company to the Investor Education and Protection Fund (IEPF)
Corporate Actions

No Upcoming Board Meetings

V-Mart Retail Ltd. has declared 10% dividend, ex-date: 17 Jul 26

No Splits history available

V-Mart Retail Ltd. has announced 3:1 bonus issue, ex-date: 23 Jun 25

No Rights history available
Quality key factors
Valuation key factors
Technicals key factors
 Technical Indicator Scale: Bearish, Mildly Bearish, Sideways, Mildly Bullish, Bullish Turned
 Shareholding Snapshot : Mar 2026
Shareholding Compare (%holding)
Promoters
None
Held by 19 Schemes (31.02%)
Held by 97 FIIs (16.91%)
Conquest Business Services Pvt Ltd (37.71%)
Amansa Holdings Private Limited (7.78%)
6.08%
Quarterly Results Snapshot (Standalone) - Mar'26 - YoY

YoY Growth in quarter ended Mar 2026 is 24.46% vs 16.67% in Mar 2025

YoY Growth in quarter ended Mar 2026 is -39.06% vs 147.56% in Mar 2025
Half Yearly Results Snapshot (Standalone) - Sep'25
Growth in half year ended Sep 2025 is 16.93% vs 17.84% in Sep 2024
Growth in half year ended Sep 2025 is 155.74% vs 48.45% in Sep 2024
Nine Monthly Results Snapshot (Standalone) - Dec'25
YoY Growth in nine months ended Dec 2025 is 13.93% vs 16.85% in Dec 2024
YoY Growth in nine months ended Dec 2025 is 313.50% vs 147.13% in Dec 2024
Annual Results Snapshot (Standalone) - Mar'26
YoY Growth in year ended Mar 2026 is 16.46% vs 16.81% in Mar 2025
YoY Growth in year ended Mar 2026 is 170.92% vs 147.30% in Mar 2025
About V-Mart Retail Ltd.

Company Coordinates


