
Compare Avonmore Capital with Similar Stocks
Dashboard
With a Operating Losses, the company has a Weak Long Term Fundamental Strength
- Poor long term growth as Operating profit has grown by an annual rate of -4.16%
- PAT(Q) At Rs -9.52 cr has Fallen at -270.3%
- CASH AND CASH EQUIVALENTS(HY) Lowest at Rs 9.76 cr
- PBDIT(Q) Lowest at Rs -10.73 cr.
With ROE of 2, it has a Expensive valuation with a 0.7 Price to Book Value
Below par performance in long term as well as near term
Stock DNA
Non Banking Financial Company (NBFC)
INR 281 Cr (Micro Cap)
35.00
21
0.00%
0.06
2.04%
0.73
Total Returns (Price + Dividend) 
Latest dividend: 0.046755000000000005 per share ex-dividend date: Sep-03-2007
Risk Adjusted Returns v/s
Returns Beta

News

Avonmore Capital & Management Services Ltd is Rated Strong Sell
Avonmore Capital & Management Services Ltd is rated Strong Sell by MarketsMOJO. This rating was last updated on 27 May 2026, reflecting a shift from the previous 'Sell' grade. However, the analysis and financial metrics discussed below represent the stock's current position as of 14 July 2026, providing investors with an up-to-date view of the company’s fundamentals, valuation, financial trends, and technical outlook.
Read full news article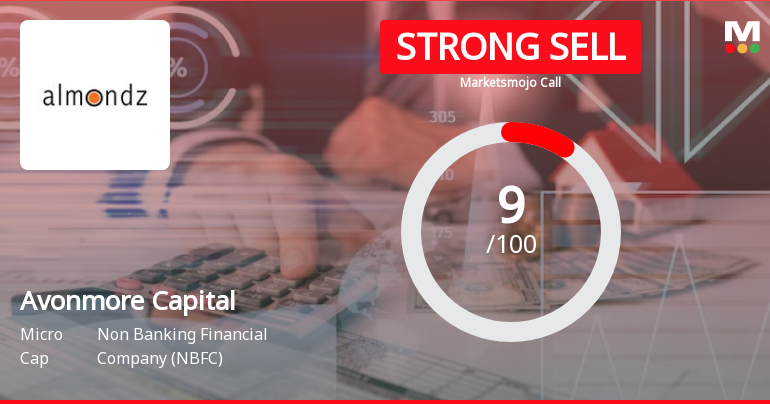
Avonmore Capital & Management Services Ltd is Rated Strong Sell
Avonmore Capital & Management Services Ltd is rated Strong Sell by MarketsMOJO. This rating was last updated on 27 May 2026, reflecting a significant reassessment of the stock’s outlook. However, all fundamentals, returns, and financial metrics discussed here are current as of 03 July 2026, providing investors with the latest perspective on the company’s position.
Read full news article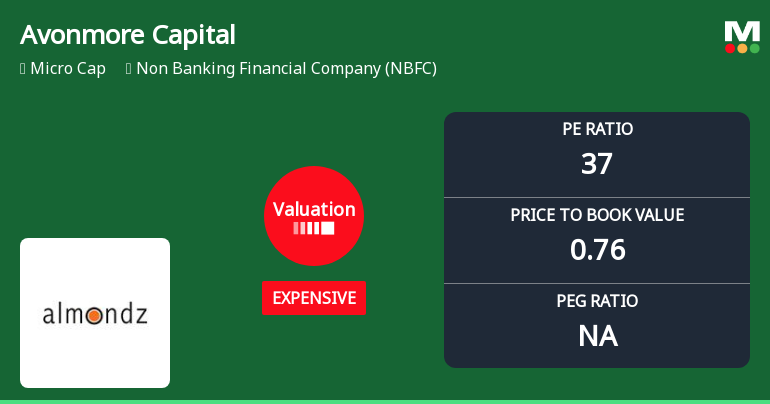
Avonmore Capital & Management Services Ltd: Valuation Shifts Signal Price Attractiveness Change
Avonmore Capital & Management Services Ltd, a micro-cap player in the Non Banking Financial Company (NBFC) sector, has seen its valuation parameters shift notably, prompting a reassessment of its price attractiveness. Despite a modest day gain of 0.59%, the company’s price-to-earnings (P/E) and price-to-book value (P/BV) ratios reflect an expensive valuation relative to peers and historical averages, while its returns have lagged broader market benchmarks over recent periods.
Read full news article Announcements
Compliances-Certificate under Reg. 74 (5) of SEBI (DP) Regulations 2018
06-Jul-2026 | Source : BSECertificate Under Regulation 74(5) of SEBI (DP) Regulations 2018
Closure of Trading Window
26-Jun-2026 | Source : BSEClosure of Trading Window
Announcement under Regulation 30 (LODR)-Press Release / Media Release
11-Jun-2026 | Source : BSEPress Release
Corporate Actions

No Upcoming Board Meetings

Avonmore Capital & Management Services Ltd has declared 5% dividend, ex-date: 03 Sep 07

Avonmore Capital & Management Services Ltd has announced 1:10 stock split, ex-date: 28 Jun 24

No Bonus history available

Avonmore Capital & Management Services Ltd has announced 5:24 rights issue, ex-date: 12 Dec 24
Quality key factors
Valuation key factors
Technicals key factors
 Technical Indicator Scale: Bearish, Mildly Bearish, Sideways, Mildly Bullish, Bullish Turned
 Shareholding Snapshot : Mar 2026
Shareholding Compare (%holding)
Promoters
None
Held by 0 Schemes
Held by 2 FIIs (0.06%)
Innovative Money Matters Private Limited (33.14%)
Sahi Logistics & Infra Private Limited (5.97%)
29.83%
Quarterly Results Snapshot (Consolidated) - Mar'26 - YoY

YoY Growth in quarter ended Mar 2026 is 7.54% vs 19.19% in Mar 2025
YoY Growth in quarter ended Mar 2026 is -270.30% vs 476.29% in Mar 2025
Half Yearly Results Snapshot (Consolidated) - Sep'25
Growth in half year ended Sep 2025 is -17.69% vs 106.30% in Sep 2024
Growth in half year ended Sep 2025 is -64.41% vs 269.70% in Sep 2024
Nine Monthly Results Snapshot (Consolidated) - Dec'25
YoY Growth in nine months ended Dec 2025 is 5.51% vs 65.32% in Dec 2024
YoY Growth in nine months ended Dec 2025 is -25.62% vs 121.57% in Dec 2024
Annual Results Snapshot (Consolidated) - Mar'26
YoY Growth in year ended Mar 2026 is 5.42% vs 46.31% in Mar 2025
YoY Growth in year ended Mar 2026 is -52.48% vs 1,587.18% in Mar 2025
About Avonmore Capital & Management Services Ltd

Company Coordinates


