
Compare AVT Natural Prod with Similar Stocks
Stock DNA
Other Agricultural Products
INR 1,073 Cr (Micro Cap)
17.00
21
1.07%
-0.07
11.59%
1.91
Total Returns (Price + Dividend) 
Latest dividend: 0.3502142310635042 per share ex-dividend date: Feb-18-2026
Risk Adjusted Returns v/s
Returns Beta

News
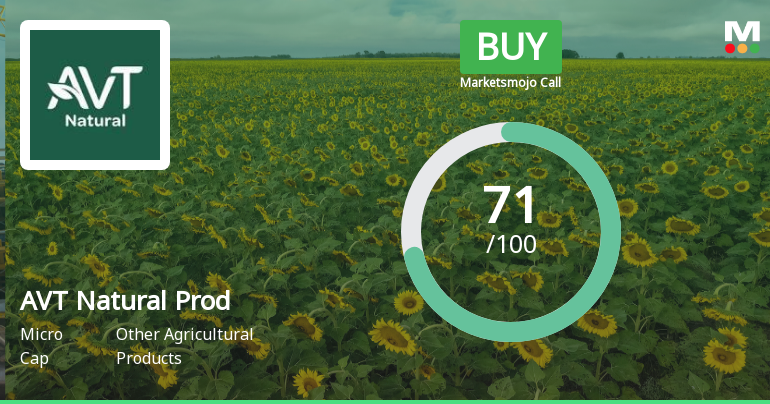
AVT Natural Products Ltd Upgraded to Buy on Improved Technicals and Attractive Valuation
AVT Natural Products Ltd, a micro-cap player in the Other Agricultural Products sector, has seen its investment rating upgraded from Hold to Buy as of 9 July 2026. This upgrade reflects a confluence of improved technical indicators, attractive valuation metrics, positive financial trends, and solid quality assessments, signalling renewed investor confidence in the stock’s prospects.
Read full news article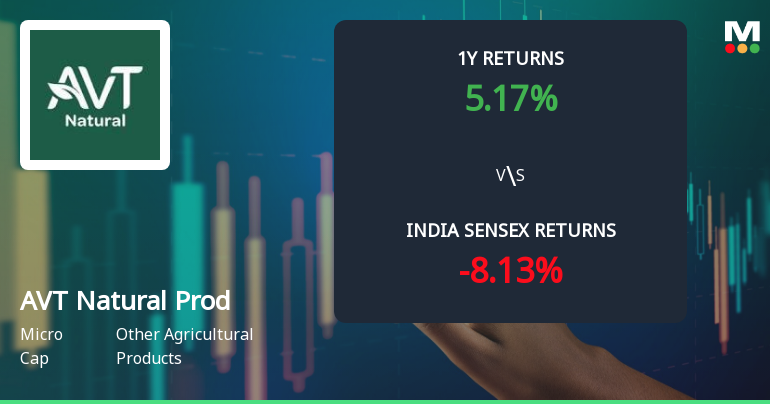
AVT Natural Products Ltd Technical Momentum Shifts to Bullish Amid Market Recovery
AVT Natural Products Ltd, a micro-cap player in the Other Agricultural Products sector, has witnessed a notable shift in its technical momentum, upgrading from a mildly bullish to a bullish stance. This change is underscored by improvements across key technical indicators including MACD, moving averages, and KST, signalling renewed investor interest and potential upside in the near term.
Read full news article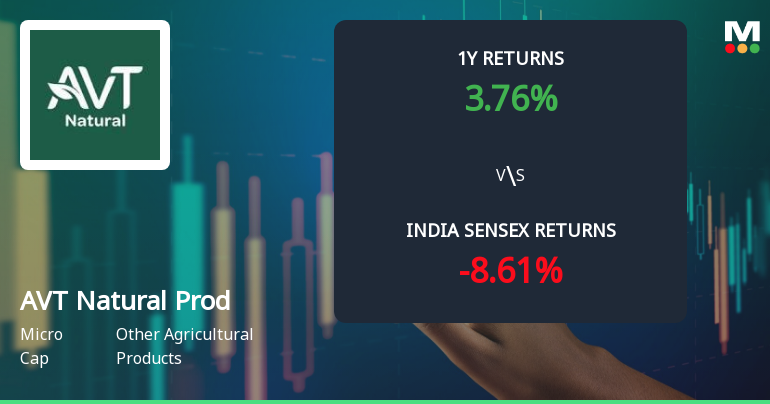
AVT Natural Products Ltd Sees Technical Momentum Shift Amid Mixed Market Returns
AVT Natural Products Ltd, a micro-cap player in the Other Agricultural Products sector, has experienced a notable shift in its technical momentum, moving from a bullish to a mildly bullish stance. Despite a recent downgrade in its Mojo Grade from Buy to Hold, the stock’s technical indicators reveal a complex interplay of signals that investors should carefully analyse amid broader market trends.
Read full news article Announcements
AVT Natural Products Limited - Outcome of Board Meeting
08-Nov-2019 | Source : NSEAVT Natural Products Limited has informed the Exchange regarding Board meeting held on November 08, 2019.
Updates
10-Aug-2019 | Source : NSE
| AVT Natural Products Limited has informed the Exchange regarding 'VOTING RESULTS OF THE AGM AND SCRUTINIZERS REPORT SUBMITTED'. |
Financial Result Updates
09-Aug-2019 | Source : NSE
| AVT Natural Products Limited has submitted to the Exchange, the financial results for the period ended June 30, 2019. |
Corporate Actions

No Upcoming Board Meetings

AVT Natural Products Ltd has declared 45% dividend, ex-date: 10 Aug 26

AVT Natural Products Ltd has announced 1:10 stock split, ex-date: 07 Jun 12

AVT Natural Products Ltd has announced 1:1 bonus issue, ex-date: 26 Sep 13

No Rights history available
Quality key factors
Valuation key factors
Technicals key factors
 Technical Indicator Scale: Bearish, Mildly Bearish, Sideways, Mildly Bullish, Bullish Turned
 Shareholding Snapshot : Jun 2026
Shareholding Compare (%holding)
Promoters
None
Held by 0 Schemes
Held by 4 FIIs (0.04%)
Neelamalai Agro Industries Ltd (40.0%)
Vistra Itcl India Limited (1.01%)
19.3%
Quarterly Results Snapshot (Consolidated) - Mar'26 - YoY

YoY Growth in quarter ended Mar 2026 is 44.43% vs 25.44% in Mar 2025
YoY Growth in quarter ended Mar 2026 is 53.34% vs 31.02% in Mar 2025
Half Yearly Results Snapshot (Consolidated) - Sep'25
Growth in half year ended Sep 2025 is 29.33% vs -4.91% in Sep 2024
Growth in half year ended Sep 2025 is 107.09% vs -38.40% in Sep 2024
Nine Monthly Results Snapshot (Consolidated) - Dec'25
YoY Growth in nine months ended Dec 2025 is 21.92% vs 1.78% in Dec 2024
YoY Growth in nine months ended Dec 2025 is 26.31% vs -19.99% in Dec 2024
Annual Results Snapshot (Consolidated) - Mar'26
YoY Growth in year ended Mar 2026 is 28.27% vs 7.50% in Mar 2025
YoY Growth in year ended Mar 2026 is 34.38% vs -9.50% in Mar 2025
About AVT Natural Products Ltd

Company Coordinates


