Bombay Super Hyb

  • Market Cap: Micro Cap
  • Industry: Other Agricultural Products
  • ISIN: INE032Z01020
  • NSEID: BSHSL
  • BSEID: 544757
INR
89.91
0.88 (0.99%)
BSENSE

Sep 02, 03:30 PM

BSE+NSE Vol: 3.06 k

  • Price Points
  • Score
  • Mojo Parameters
  • Total Return
  • News and Corporate Actions
  • Key factors
  • Shareholding
  • Financials
  • CompanyCV
stock-summaryPrice Point
High/Low

1Day

52 Week

Valuation
Technical
Day's Volume

CASH

3.06 k (-59.00%) Volume

Shareholding (Jun 2026)

FII

0.00%

Held by 1 FIIs

DII

0.00%

Held by 0 DIIs

Promoter

73.85%

Why is Bombay Super Hybrid Seeds Ltd falling/rising?

02-Sep-2026

As of 01-Sep, the stock price of Bombay Super Hybrid Seeds Ltd is stable at 88.22, with positive financial performance indicators and increased investor participation suggesting potential for future growth, despite trading below moving averages indicating a bearish trend.

As of 01-Sep, the stock price of Bombay Super Hybrid Seeds Ltd is currently stable at 88.22, with no change noted (0.00%). Despite this stability in price, the stock has shown some positive performance indicators. Over the past week, it has outperformed the benchmark Sensex, gaining 0.19% while the Sensex declined by 0.92%. <BR><BR>Investor participation appears to be increasing, as evidenced by a delivery volume of 5.5k on 31 August, which has risen by 18.87% compared to the 5-day average. This suggests a growing interest among investors, which could be a contributing factor to the stock's stability and potential for future growth.<BR><BR>However, it is important to note that the stock is currently trading below its moving averages across various time frames (5-day, 20-day, 50-day, 100-day, and 200-day), indicating a bearish trend in the short to medium term. <BR><BR>On the financial performance front, the company has reported significant growth in profit before tax (PBT) and profit after tax (PAT) for the latest quarter, with PBT growing at 114.2% and PAT at 114.6% compared to the previous four-quarter average. Additionally, net sales reached their highest at Rs 182.57 crore. These strong financial results, combined with a return on capital employed (ROCE) of 14.2 and a fair valuation compared to peers, suggest that the stock has solid fundamentals.<BR><BR>In summary, while the stock price remains unchanged at 88.22, the positive financial performance and increased investor participation may support a potential rise in the stock's value in the future, despite its current position below moving averages.

View full answer

Which are the latest news on Bombay Super Hyb?

02-Sep-2026

Should I buy, sell or hold Bombay Super Hybrid Seeds Ltd?

02-Sep-2026

Who are in the management team of Bombay Super Hyb?

01-Sep-2026

The management team of Bombay Super Hyb includes Arvindkumar Jadavjibhai Kakadia (Chairman & Managing Director), Kiritkumar Jadavjibhai Kakadia (Whole-time Director), and several other directors and independent directors, totaling 11 key members responsible for the company's operations and strategic direction.

The management team of Bombay Super Hyb includes the following individuals:<BR><BR>1. **Arvindkumar Jadavjibhai Kakadia** - Chairman & Managing Director<BR>2. **Kiritkumar Jadavjibhai Kakadia** - Whole-time Director<BR>3. **Kishorkumar Devrajbhai Kakadiya** - Director<BR>4. **Hemang Chandrakant Baxi** - Executive Director<BR>5. **Jadavjibhai Devrajbhai Patel** - Director<BR>6. **Dineshchandra Dhirajlal Sakaria** - Independent Director<BR>7. **Dharmesh Dineshbhai Chotai** - Independent Director<BR>8. **Hardikkumar Manilal Patel** - Independent Director<BR>9. **Naynaben Rameshbhai Kapuriya** - Independent Director<BR>10. **Mona Kishorebhai Rathod** - Company Secretary<BR>11. **Amit K Gandhiya** - Additional Independent Director<BR><BR>This team is responsible for overseeing the company's operations and strategic direction.

View full answer

What does Bombay Super Hyb do?

01-Sep-2026

Bombay Super Hybrid Seeds Ltd is a micro-cap company in the agricultural products sector, specializing in hybrid seeds. As of June 2026, it reported net sales of ₹183 Cr and a net profit of ₹14 Cr, with a market cap of ₹973 Cr.

Overview:<BR>Bombay Super Hybrid Seeds Ltd operates in the Other Agricultural Products industry and is categorized as a Micro Cap company.<BR><BR>History:<BR>The company was originally incorporated in 2000 under the name "Jadavjibhai Devrajbhai Patel." It underwent several name changes, becoming "Patel Jadavjibhai Devrahbhai" in 2012, "Bombay Super Agriseeds" in 2014, and finally "Bombay Super Hybrid Seeds" in 2014. The latest quarterly results reported net sales and net profit for June 2026.<BR><BR>Financial Snapshot:<BR>- Net Sales: 183 Cr (Quarterly Results - Jun 2026)<BR>- Net Profit: 14 Cr (Quarterly Results - Jun 2026)<BR>- Market Cap: INR 973 Cr (Micro Cap)<BR><BR>Key Metrics:<BR>- P/E: 32.00<BR>- Industry P/E: 43<BR>- Dividend Yield: 0.00%<BR>- Debt-Equity: 0.82<BR>- Return on Equity: 21.90%<BR>- Price to Book: 7.21<BR><BR>Contact Details:<BR>Address: Shrinathji Indl Est Plot No 11, 8-B National Highway Rajkot Gujarat : 360023<BR>Tel: 91-9687967096<BR>Email: cs@bombaysuper.in<BR>Website: http://www.bombaysuperseeds.com

View full answer

Who are the peers of the Bombay Super Hyb?

01-Sep-2026

Peers of Bombay Super Hyb include Chamanlal Setia, AVT Natural Prod, Gulshan Polyols, Krishival Foods, Regaal Resources, Sukhjit Starch, Mangalam Global, Modi Naturals, and KN Agri Resource. Krishival Foods shows excellent growth and management risk, while other peers have varying levels of growth and management risk, with AVT Natural Prod achieving the highest 1-year return at 26.84%.

Peers: The peers of the Bombay Super Hyb are Chamanlal Setia, AVT Natural Prod, Gulshan Polyols, Krishival Foods, Regaal Resources, Sukhjit Starch, Mangalam Global, Modi Naturals, and KN Agri Resource.<BR><BR>Quality Snapshot: Excellent management risk is observed at Krishival Foods and the rest have Average management risk. Growth is Excellent at Krishival Foods and Regaal Resources, Good at Modi Naturals, Average at Bombay Super Hyb, and Below Average at Chamanlal Setia, AVT Natural Prod, Gulshan Polyols, Sukhjit Starch, Mangalam Global, and KN Agri Resource. Capital Structure is Excellent at Chamanlal Setia and AVT Natural Prod, Good at KN Agri Resource, Average at Bombay Super Hyb and Sukhjit Starch, and Below Average at Gulshan Polyols, Regaal Resources, Mangalam Global, and Modi Naturals.<BR><BR>Return Snapshot: The peer with the highest 1-year return is AVT Natural Prod at 26.84%, while the peer with the lowest is Regaal Resources at -22.69%. The Bombay Super Hyb does not have a 1-year return available for comparison. Additionally, Sukhjit Starch, Modi Naturals, and Regaal Resources have negative six-month returns.

View full answer

How big is Bombay Super Hyb?

01-Sep-2026

As of 31st August, Bombay Super Hybrid Seeds Ltd has a market capitalization of 973.00 Cr, with recent net sales of 373.72 Cr and a net profit of 28.69 Cr. The balance sheet for March 2025 shows shareholder's funds of 104.68 Cr and total assets of 221.26 Cr.

As of 31st August, Bombay Super Hybrid Seeds Ltd has a market capitalization of 973.00 Cr, categorizing it as a Micro Cap company.<BR><BR>In the latest four quarters, the company reported Net Sales of 373.72 Cr and a Net Profit of 28.69 Cr.<BR><BR>The latest annual period for the balance sheet is March 2025, showing Shareholder's Funds of 104.68 Cr and Total Assets of 221.26 Cr.

View full answer

When is the next results date for Bombay Super Hybrid Seeds Ltd?

04-Aug-2026

The next results date for Bombay Super Hybrid Seeds Ltd is August 7, 2026.

The next results date for Bombay Super Hybrid Seeds Ltd is scheduled for August 7, 2026.

View full answer

Are Bombay Super Hybrid Seeds Ltd latest results good or bad?

26-May-2026

Bombay Super Hybrid Seeds Ltd's latest results show strong year-on-year revenue growth of 44.70%, but a significant sequential decline of 32.12% in revenue and a 43.02% drop in net profit indicate challenges in the current quarter. Overall, while annual growth is positive, recent performance trends raise concerns.

Bombay Super Hybrid Seeds Ltd's latest results present a mixed picture. On one hand, the company reported a significant year-on-year revenue growth of 44.70%, reaching ₹66.43 crores in Q4 FY26, which indicates strong underlying demand for its products. However, this figure represents a sharp sequential decline of 32.12% from the previous quarter, reflecting the seasonal nature of the agricultural seeds business, where Q4 is typically weaker.<BR><BR>Net profit for the quarter was ₹4.41 crores, which is down 43.02% compared to the previous quarter but shows a slight increase of 4.50% year-on-year. The operating margin also saw a decline, dropping to 9.86% from 13.35% in the same quarter last year, indicating pressure on profitability due to rising input costs or competitive dynamics.<BR><BR>Overall, while the year-on-year growth is a positive sign, the sequential declines in both revenue and profit, along with margin compression, suggest that the company is facing challenges that need to be addressed. Therefore, the results can be viewed as good in terms of annual growth but concerning due to the recent performance trends.

View full answer

How has been the historical performance of Bombay Super Hyb?

09-Nov-2025

Bombay Super Hyb has shown consistent growth in net sales and profitability, with net sales increasing from 103.25 Cr in March 2020 to 358.76 Cr in March 2025. Despite recent challenges in cash flow, the company has improved its operating profit and profit before tax significantly during this period.

Answer:<BR>The historical performance of Bombay Super Hyb shows a consistent growth in net sales and profitability over the years, culminating in the latest figures for March 2025.<BR><BR>Breakdown:<BR>Bombay Super Hyb has demonstrated significant growth in net sales, increasing from 103.25 Cr in March 2020 to 358.76 Cr in March 2025. The total operating income has mirrored this trend, reaching 358.76 Cr in March 2025, up from 84.40 Cr in March 2018. The company's total expenditure, excluding depreciation, has also risen, amounting to 326.03 Cr in March 2025, which reflects the increased costs associated with higher sales. Operating profit, excluding other income, has improved to 32.73 Cr in March 2025 from 5.96 Cr in March 2020, indicating a stronger operational efficiency. Profit before tax has increased to 28.06 Cr in March 2025, up from 3.46 Cr in March 2020, while profit after tax reached 26.41 Cr in March 2025, compared to 2.66 Cr in March 2020. The company's total assets have grown to 221.26 Cr in March 2025 from 46.77 Cr in March 2020, with total liabilities also increasing to 221.26 Cr. The cash flow from operating activities has shown a negative trend in March 2025 at -31.00 Cr, contrasting with positive cash flows in earlier years. Overall, the financial metrics indicate a robust growth trajectory for Bombay Super Hyb, despite recent challenges in cash flow management.

View full answer

Is Bombay Super Hyb overvalued or undervalued?

29-Sep-2025

As of September 26, 2025, Bombay Super Hyb is considered expensive and overvalued with a PE ratio of 50.07, significantly higher than its peers, and has underperformed with a year-to-date return of -15.1%.

As of 26 September 2025, the valuation grade for Bombay Super Hyb has moved from very expensive to expensive. The company is currently considered overvalued based on its high valuation ratios, including a PE ratio of 50.07, an EV to EBITDA of 42.66, and a PEG ratio of 2.34. These figures indicate that the stock is trading at a significant premium compared to its earnings growth potential.<BR><BR>In comparison to its peers, Bombay Super Hyb's valuation stands out as notably high. For instance, Jain Irrigation, which is rated attractive, has a PE ratio of 110.1, while Indo US Bio-Tech, rated fair, has a PE of 14.77. The disparity in these ratios suggests that Bombay Super Hyb may not justify its current price in relation to its earnings and growth prospects. Additionally, the company's recent stock performance has been underwhelming, with a year-to-date return of -15.1%, contrasting with a positive return of 4.27% for the Sensex during the same period.

View full answer

Is Bombay Super Hyb technically bullish or bearish?

09-Sep-2025

As of September 8, 2025, the technical trend for Bombay Super Hyb has shifted to a bearish stance, supported by bearish indicators across multiple time frames, including moving averages and the KST.

As of 8 September 2025, the technical trend has changed from mildly bearish to bearish. The current stance is bearish with moderate strength. The weekly MACD is mildly bullish, but the monthly MACD is bearish, indicating a divergence in time frames. The Bollinger Bands and moving averages are both bearish on the weekly and daily charts, reinforcing the bearish outlook. The KST is mildly bearish on the weekly and bearish on the monthly, while Dow Theory shows a mildly bearish trend on the weekly with no trend on the monthly. Overall, the combination of these indicators suggests a bearish sentiment for Bombay Super Hyb.

View full answer

Who are the top shareholders of the Bombay Super Hyb?

17-Jul-2025

The top shareholder of Bombay Super Hyb is Arvindkumar Jadavjibhai Kakadia, holding 28.49%. Other notable shareholders include Rushil G Ramani with 1.61% and individual investors collectively owning 25.17%.

The top shareholders of Bombay Super Hyb include the promoters, with Arvindkumar Jadavjibhai Kakadia holding the largest share at 28.49%. There are no pledged promoter holdings, and the company has one foreign institutional investor (FII) holding a minimal 0.01%. The highest public shareholder is Rushil G Ramani, who owns 1.61%. Additionally, individual investors collectively hold 25.17% of the shares.

View full answer

What is the bonus history of the Bombay Super Hyb?

06-Jun-2025

Bombay Super Hybrid Seeds Ltd has issued bonuses in the past, with the most recent being a 1:3 bonus on August 27, 2020, and a previous 1:5 bonus on October 22, 2019, demonstrating the company's commitment to rewarding shareholders.

Bombay Super Hybrid Seeds Ltd has a history of bonus issues. The most recent bonus was a 1:3 bonus issue, which was announced with an ex-date of August 27, 2020, and a record date of August 28, 2020. Prior to that, the company issued a bonus in a 1:5 ratio, with an ex-date of October 22, 2019, and a record date of October 23, 2019. This reflects the company's approach to rewarding its shareholders through bonus shares over the past few years.

View full answer

Has Bombay Super Hyb declared dividend?

06-Jun-2025

No Dividend History Available

iScoreScore
Click here to find our call on this stock
Strong Sell
Sell
Hold
Buy
Strong Buy

Dashboard

1

Despite the size of the company, domestic mutual funds hold only 0% of the company

  • Domestic mutual funds have capability to do in-depth on-the-ground research on companies- their small stake may signify either they are not comfortable at the price or the business
2

Consistent Underperformance against the benchmark over the last 3 years

stock-summaryMojo Parameters

Mojo Parameters

Loading Valuation Snapshot...

Stock DNA

stock-summary
Industry

Other Agricultural Products

stock-summary
Market cap

INR 934 Cr (Micro Cap)

stock-summary
P/E

32.00

stock-summary
Industry P/E

42

stock-summary
Dividend Yield

0.00%

stock-summary
Debt Equity

0.82

stock-summary
Return on Equity

21.90%

stock-summary
Price to Book

7.07

Revenue and Profits:
Net Sales:
183 Cr
(Quarterly Results - Jun 2026)
Net Profit:
14 Cr
stock-summaryTotal Returns
Total Returns (Price + Dividend) stock-summary
Dividend Yield (0%)
TimePeriod
Price Return
Dividend Return
Total Return
3 Months
-7.6%
0%
-7.6%
6 Months
6.19%
0%
6.19%
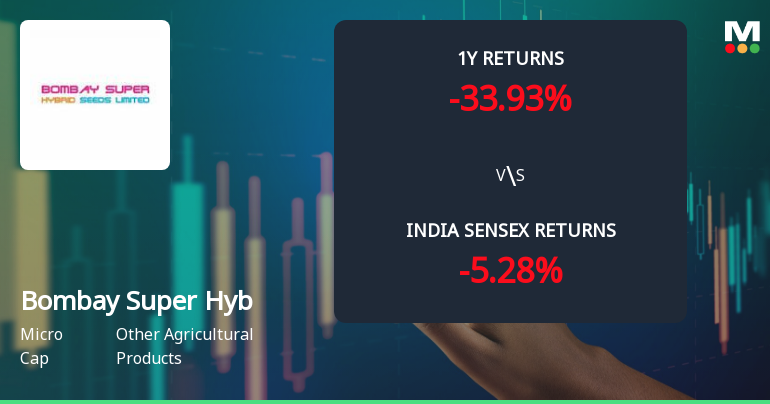
1 Year
-36.16%
0%
-36.16%
2 Years
-52.52%
0%
-52.52%
3 Years
-60.72%
0%
-60.72%
4 Years
70.25%
0%
70.25%
5 Years
213.49%
0%
213.49%

Latest dividend: 0 per share ex-dividend date: Sep-19-2019

Risk Adjusted Returns v/s stock-summary
Returns Beta
Icon
Beta has not been calculated since enough price history is not available
stock-summaryNews & Corporate Actions

Announcements stock-summary

Bombay Super Hybrid Seeds Limited - Statement of deviation(s) or variation(s) under Reg. 32

21-Nov-2019 | Source : NSE

Bombay Super Hybrid Seeds Limited has informed the Exchange regarding Statement of deviation(s) or variation(s) under Reg. 32 of SEBI (LODR) Regulations 2015

Bombay Super Hybrid Seeds Limited - Outcome of Board Meeting

15-Nov-2019 | Source : NSE

Bombay Super Hybrid Seeds Limited has informed the Exchange regarding Board meeting held on November 14, 2019.

Corporate Actions stock-summary

stock-summary
BOARD MEETING

No Upcoming Board Meetings

stock-summary
DIVIDEND
stock-summary
SPLITS

Bombay Super Hybrid Seeds Ltd has announced 1:10 stock split, ex-date: 23 Sep 22

stock-summary
BONUS

Bombay Super Hybrid Seeds Ltd has announced 1:3 bonus issue, ex-date: 27 Aug 20

stock-summary
RIGHTS

No Rights history available

stock-summaryKey Factors

Quality key factors stock-summary

Factor
Value
Sales Growth (5y)
15.50%
EBIT Growth (5y)
26.24%
EBIT to Interest (avg)
5.96
Debt to EBITDA (avg)
1.94
Net Debt to Equity (avg)
0.82
Sales to Capital Employed (avg)
2.50
Tax Ratio
5.78%
Dividend Payout Ratio
0
Pledged Shares
0
Institutional Holding
0.00%
ROCE (avg)
20.32%
ROE (avg)
26.07%

Valuation key factors

Factor
Value
P/E Ratio
32
Industry P/E
42
Price to Book Value
7.10
EV to EBIT
29.04
EV to EBITDA
27.74
EV to Capital Employed
4.35
EV to Sales
2.78
PEG Ratio
7.91
Dividend Yield
NA
ROCE (Latest)
14.23%
ROE (Latest)
21.90%

Technicals key factors

Indicator
Weekly
Monthly
MACD
RSI
No Signal
Bollinger Bands
KST
Dow Theory
No Trend
OBV
Mildly Bearish
stock-summary Technical Indicator Scale: Bearish, Mildly Bearish, Sideways, Mildly Bullish, Bullish  Turned 
stock-summaryShareholding
Shareholding Snapshot : Jun 2026stock-summary
Shareholding Compare (%holding) stock-summary
Majority shareholders

Promoters

Pledged Promoter Holdings

None

Mutual Funds

Held by 0 Schemes

FIIs

Held by 1 FIIs (0.0%)

Promoter with highest holding

Arvindkumar Jadavjibhai Kakadia (28.49%)

Highest Public shareholder

None

Individual Investors Holdings

25.17%

stock-summaryFinancial
[
  {
    "link": "quarterly",
    "btn_text": "All Quarterly Results",
    "header": "Quarterly Results Snapshot (Standalone) - Jun'26 - QoQ",
    "rhs": [
      {
        "prefix": "Net Sales ",
        "suffix": "QoQ Growth in quarter ended Jun 2026 is 174.83% vs -32.12% in Mar 2026",
        "dir": 1
      },
      {
        "prefix": "Standalone Net Profit ",
        "suffix": "QoQ Growth in quarter ended Jun 2026 is 224.26% vs -43.02% in Mar 2026",
        "dir": 1
      }
    ],
    "table": {
      "header": [
        "Jun'26",
        "Mar'26",
        "Change(%)"
      ],
      "body": [
        {
          "field": "Net Sales",
          "val1": "182.57",
          "val2": "66.43",
          "chgp": "174.83%",
          "chgp_class": "positive"
        },
        {
          "field": "Operating Profit (PBDIT) excl Other Income",
          "val1": "17.14",
          "val2": "6.55",
          "chgp": "161.68%",
          "chgp_class": "positive"
        },
        {
          "field": "Interest",
          "val1": "2.04",
          "val2": "2.11",
          "chgp": "-3.32%",
          "chgp_class": "positive"
        },
        {
          "field": "Exceptional Items",
          "val1": "0.00",
          "val2": "0.00",
          "chgp": "",
          "chgp_class": "neutral"
        },
        {
          "field": "Standalone Net Profit",
          "val1": "14.30",
          "val2": "4.41",
          "chgp": "224.26%",
          "chgp_class": "positive"
        },
        {
          "field": "Operating Profit Margin (Excl OI)",
          "val1": "9.39%",
          "val2": "9.86%",
          "chgp": "-0.47%",
          "chgp_class": "negative"
        }
      ]
    }
  },
  {
    "link": "half-yearly",
    "btn_text": "All Half Yearly Results",
    "header": "Half Yearly Results Snapshot (Standalone) - Sep'25",
    "rhs": [
      {
        "prefix": "Net Sales ",
        "suffix": " Growth in half year ended Sep 2025 is -2.81% vs 22.98% in Sep 2024",
        "dir": -1
      },
      {
        "prefix": "Standalone Net Profit ",
        "suffix": " Growth in half year ended Sep 2025 is 10.01% vs 8.03% in Sep 2024",
        "dir": 1
      }
    ],
    "table": {
      "header": [
        "Sep'25",
        "Sep'24",
        "Change(%)"
      ],
      "body": [
        {
          "field": "Net Sales",
          "val1": "179.79",
          "val2": "184.98",
          "chgp": "-2.81%",
          "chgp_class": "negative"
        },
        {
          "field": "Operating Profit (PBDIT) excl Other Income",
          "val1": "19.50",
          "val2": "16.66",
          "chgp": "17.05%",
          "chgp_class": "positive"
        },
        {
          "field": "Interest",
          "val1": "3.37",
          "val2": "2.92",
          "chgp": "15.41%",
          "chgp_class": "negative"
        },
        {
          "field": "Exceptional Items",
          "val1": "0.00",
          "val2": "0.00",
          "chgp": "",
          "chgp_class": "neutral"
        },
        {
          "field": "Standalone Net Profit",
          "val1": "14.51",
          "val2": "13.19",
          "chgp": "10.01%",
          "chgp_class": "positive"
        },
        {
          "field": "Operating Profit Margin (Excl OI)",
          "val1": "10.85%",
          "val2": "9.01%",
          "chgp": "1.84%",
          "chgp_class": "positive"
        }
      ]
    }
  },
  {
    "link": "nine-monthly",
    "btn_text": "All Nine Monthly Results",
    "header": "Nine Monthly Results Snapshot (Standalone) - Dec'25",
    "rhs": [
      {
        "prefix": "Net Sales ",
        "suffix": "YoY Growth in nine months ended Dec 2025 is -11.25% vs 37.96% in Dec 2024",
        "dir": -1
      },
      {
        "prefix": "Standalone Net Profit ",
        "suffix": "YoY Growth in nine months ended Dec 2025 is 0.27% vs 16.24% in Dec 2024",
        "dir": -1
      }
    ],
    "table": {
      "header": [
        "Dec'25",
        "Dec'24",
        "Change(%)"
      ],
      "body": [
        {
          "field": "Net Sales",
          "val1": "277.66",
          "val2": "312.84",
          "chgp": "-11.25%",
          "chgp_class": "negative"
        },
        {
          "field": "Operating Profit (PBDIT) excl Other Income",
          "val1": "29.08",
          "val2": "26.59",
          "chgp": "9.36%",
          "chgp_class": "positive"
        },
        {
          "field": "Interest",
          "val1": "4.33",
          "val2": "4.24",
          "chgp": "2.12%",
          "chgp_class": "negative"
        },
        {
          "field": "Exceptional Items",
          "val1": "0.00",
          "val2": "0.00",
          "chgp": "",
          "chgp_class": "neutral"
        },
        {
          "field": "Standalone Net Profit",
          "val1": "22.25",
          "val2": "22.19",
          "chgp": "0.27%",
          "chgp_class": "positive"
        },
        {
          "field": "Operating Profit Margin (Excl OI)",
          "val1": "10.47%",
          "val2": "8.50%",
          "chgp": "1.97%",
          "chgp_class": "positive"
        }
      ]
    }
  },
  {
    "link": "annual",
    "btn_text": "All Annual Results",
    "header": "Annual Results Snapshot (Standalone) - Mar'26",
    "rhs": [
      {
        "prefix": "Net Sales ",
        "suffix": "YoY Growth in year ended Mar 2026 is -4.09% vs 39.66% in Mar 2025",
        "dir": -1
      },
      {
        "prefix": "Standalone Net Profit ",
        "suffix": "YoY Growth in year ended Mar 2026 is 0.95% vs 18.86% in Mar 2025",
        "dir": -1
      }
    ],
    "table": {
      "header": [
        "Mar'26",
        "Mar'25",
        "Change(%)"
      ],
      "body": [
        {
          "field": "Net Sales",
          "val1": "344.08",
          "val2": "358.76",
          "chgp": "-4.09%",
          "chgp_class": "negative"
        },
        {
          "field": "Operating Profit (PBDIT) excl Other Income",
          "val1": "35.63",
          "val2": "32.73",
          "chgp": "8.86%",
          "chgp_class": "positive"
        },
        {
          "field": "Interest",
          "val1": "6.44",
          "val2": "6.15",
          "chgp": "4.72%",
          "chgp_class": "negative"
        },
        {
          "field": "Exceptional Items",
          "val1": "0.00",
          "val2": "0.00",
          "chgp": "",
          "chgp_class": "neutral"
        },
        {
          "field": "Standalone Net Profit",
          "val1": "26.66",
          "val2": "26.41",
          "chgp": "0.95%",
          "chgp_class": "positive"
        },
        {
          "field": "Operating Profit Margin (Excl OI)",
          "val1": "10.36%",
          "val2": "9.12%",
          "chgp": "1.24%",
          "chgp_class": "positive"
        }
      ]
    }
  }
]

Quarterly Results Snapshot (Standalone) - Jun'26 - QoQstock-summary

Jun'26
Mar'26
Change(%)
Net Sales
182.57
66.43
174.83%
Operating Profit (PBDIT) excl Other Income
17.14
6.55
161.68%
Interest
2.04
2.11
-3.32%
Exceptional Items
0.00
0.00
Standalone Net Profit
14.30
4.41
224.26%
Operating Profit Margin (Excl OI)
9.39%
9.86%
-0.47%
Values in Rs Cr.
Direction Arrows
Net Sales

QoQ Growth in quarter ended Jun 2026 is 174.83% vs -32.12% in Mar 2026

Direction Arrows
Standalone Net Profit

QoQ Growth in quarter ended Jun 2026 is 224.26% vs -43.02% in Mar 2026

Half Yearly Results Snapshot (Standalone) - Sep'25stock-summary

Sep'25
Sep'24
Change(%)
Net Sales
179.79
184.98
-2.81%
Operating Profit (PBDIT) excl Other Income
19.50
16.66
17.05%
Interest
3.37
2.92
15.41%
Exceptional Items
0.00
0.00
Standalone Net Profit
14.51
13.19
10.01%
Operating Profit Margin (Excl OI)
10.85%
9.01%
1.84%
Values in Rs Cr.
Direction Arrows
Net Sales

Growth in half year ended Sep 2025 is -2.81% vs 22.98% in Sep 2024

Direction Arrows
Standalone Net Profit

Growth in half year ended Sep 2025 is 10.01% vs 8.03% in Sep 2024

Nine Monthly Results Snapshot (Standalone) - Dec'25stock-summary

Dec'25
Dec'24
Change(%)
Net Sales
277.66
312.84
-11.25%
Operating Profit (PBDIT) excl Other Income
29.08
26.59
9.36%
Interest
4.33
4.24
2.12%
Exceptional Items
0.00
0.00
Standalone Net Profit
22.25
22.19
0.27%
Operating Profit Margin (Excl OI)
10.47%
8.50%
1.97%
Values in Rs Cr.
Direction Arrows
Net Sales

YoY Growth in nine months ended Dec 2025 is -11.25% vs 37.96% in Dec 2024

Direction Arrows
Standalone Net Profit

YoY Growth in nine months ended Dec 2025 is 0.27% vs 16.24% in Dec 2024

Annual Results Snapshot (Standalone) - Mar'26stock-summary

Mar'26
Mar'25
Change(%)
Net Sales
344.08
358.76
-4.09%
Operating Profit (PBDIT) excl Other Income
35.63
32.73
8.86%
Interest
6.44
6.15
4.72%
Exceptional Items
0.00
0.00
Standalone Net Profit
26.66
26.41
0.95%
Operating Profit Margin (Excl OI)
10.36%
9.12%
1.24%
Values in Rs Cr.
Direction Arrows
Net Sales

YoY Growth in year ended Mar 2026 is -4.09% vs 39.66% in Mar 2025

Direction Arrows
Standalone Net Profit

YoY Growth in year ended Mar 2026 is 0.95% vs 18.86% in Mar 2025

stock-summaryCompany CV
About Bombay Super Hybrid Seeds Ltd stock-summary
stock-summary
Bombay Super Hybrid Seeds Ltd
Micro Cap
Other Agricultural Products
Bombay Super Hybrid Seeds Limited was originally incorporated as "Jadavjibhai Devrajbhai Patel" a partnership firm formed on April 01, 2000. The name of Partnership Firm was changed to "Patel Jadavjibhai Devrahbhai" vide Partnership Deed dated October 01, 2012. The name further changed to "Bombay Super Agriseeds" dated April 01, 2014 and again was changed to "Bombay Super Hybrid Seeds" dated June 28, 2014.
Company Coordinates stock-summary
Company Details
Shrinathji Indl Est Plot No 11, 8-B National Higway Rajkot Gujarat : 360023
stock-summary
Tel: 91-9687967096
stock-summary
cs@bombaysuper.in
Registrar Details
Skyline Financial Services Pvt Ltd , D-153/A, 1st Floor, Okhla Industrial Area, Phase - I, New Delhi