
Compare Regaal Resources with Similar Stocks
Dashboard
Healthy long term growth as Net Sales has grown by an annual rate of 52.50% and Operating profit at 107.72%
The company has declared Positive results for the last 3 consecutive quarters
With ROCE of 11.6, it has a Very Attractive valuation with a 1.3 Enterprise value to Capital Employed
Rising Promoter Confidence
Stock DNA
Other Agricultural Products
INR 823 Cr (Micro Cap)
13.00
46
0.00%
0.95
12.37%
1.67
Total Returns (Price + Dividend) 
Regaal Resources for the last several years.
Risk Adjusted Returns v/s
Returns Beta

News

Regaal Resources Ltd is Rated Hold by MarketsMOJO
Regaal Resources Ltd is rated 'Hold' by MarketsMOJO, with this rating last updated on 14 Nov 2025. However, the analysis and financial metrics discussed here reflect the company’s current position as of 13 July 2026, providing investors with an up-to-date view of the stock’s fundamentals, valuation, financial trends, and technical outlook.
Read full news article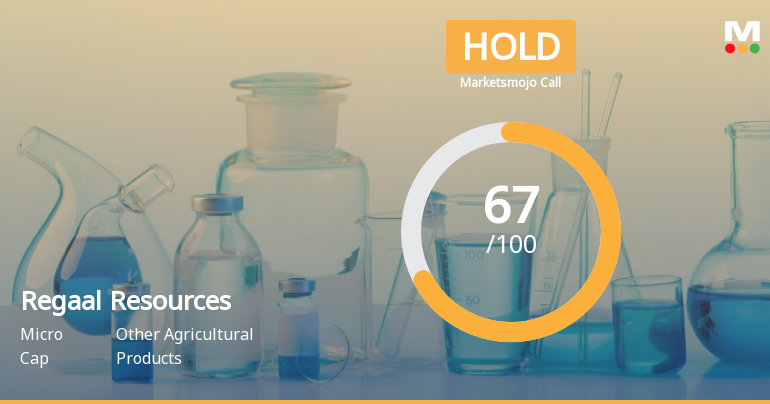
Regaal Resources Ltd is Rated Hold by MarketsMOJO
Regaal Resources Ltd is rated 'Hold' by MarketsMOJO, with this rating last updated on 14 Nov 2025. However, the analysis and financial metrics presented here reflect the company’s current position as of 02 July 2026, providing investors with an up-to-date view of its fundamentals, valuation, financial trends, and technical outlook.
Read full news article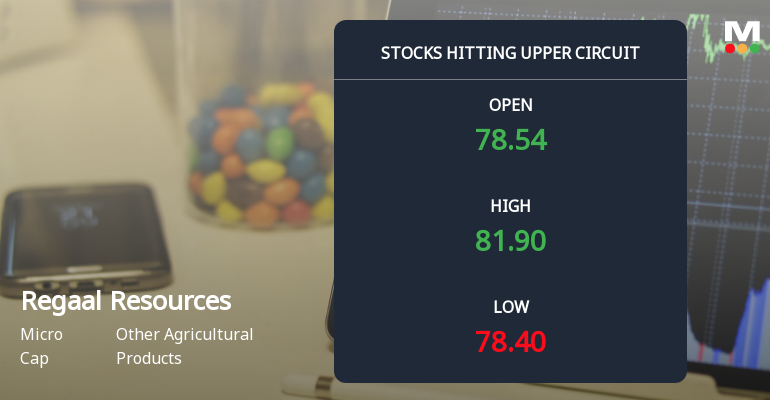
Regaal Resources Ltd Locks at Upper Circuit With 4.41% Gain — Buyers Queue, Sellers Absent
At Rs 82.46, the buying was done — not because demand dried up, but because the exchange wouldn't let the stock go any higher. Regaal Resources Ltd locked at its upper circuit of 4.41% on 2 Jul 2026, with buyers queuing and no sellers willing to part with shares.
Read full news article Announcements
Corporate Actions

No Upcoming Board Meetings

No Dividend history available

No Splits history available

No Bonus history available

No Rights history available
Quality key factors
Valuation key factors
Technicals key factors
 Technical Indicator Scale: Bearish, Mildly Bearish, Sideways, Mildly Bullish, Bullish Turned
 Shareholding Snapshot : Mar 2026
Shareholding Compare (%holding)
Promoters
None
Held by 1 Schemes (1.27%)
Held by 6 FIIs (0.34%)
Shruti Kishore Puria (27.48%)
Taurus Flexi Cap Fund (1.41%)
19.55%
Quarterly Results Snapshot (Standalone) - Mar'26 - QoQ

QoQ Growth in quarter ended Mar 2026 is -24.26% vs 0.92% in Dec 2025

QoQ Growth in quarter ended Mar 2026 is 24.83% vs -20.71% in Dec 2025
Half Yearly Results Snapshot (Standalone) - Sep'25
Not Applicable: The company has declared_date for only one period
Not Applicable: The company has declared_date for only one period
Nine Monthly Results Snapshot (Standalone) - Dec'25
Not Applicable: The company has declared_date for only one period
Not Applicable: The company has declared_date for only one period
Annual Results Snapshot (Standalone) - Mar'26
YoY Growth in year ended Mar 2026 is 23.93% vs 52.52% in Mar 2025
YoY Growth in year ended Mar 2026 is 16.55% vs 115.31% in Mar 2025
About Regaal Resources Ltd

Company Coordinates


