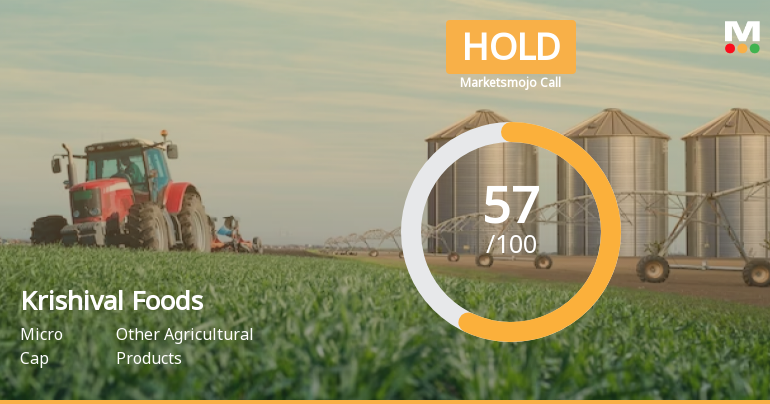
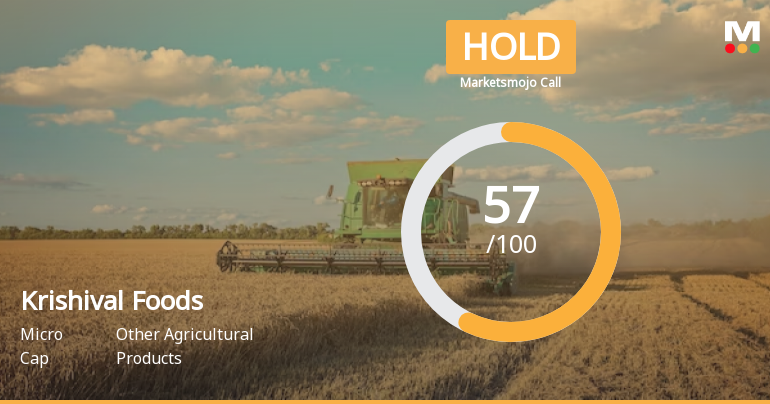
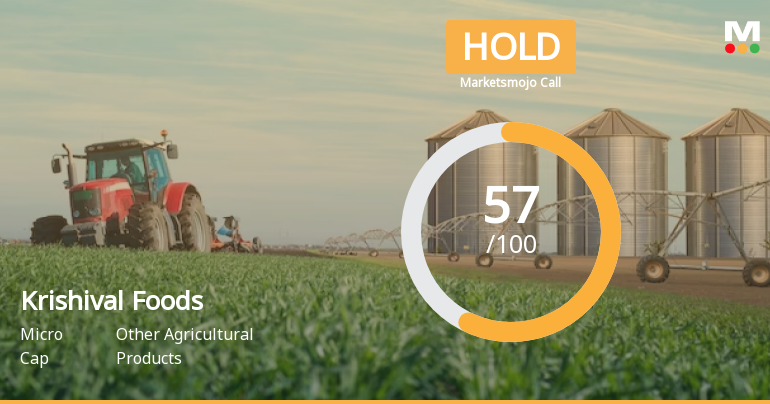
Krishival Foods

  • Market Cap: Micro Cap
  • Industry: Other Agricultural Products
  • ISIN: INE0GGO01015
  • NSEID: KRISHIVAL
  • BSEID: 544416
INR
410.35
-1 (-0.24%)
BSENSE

Sep 02, 03:30 PM

BSE+NSE Vol: 8.58 k

  • Price Points
  • Score
  • Mojo Parameters
  • Total Return
  • News and Corporate Actions
  • Key factors
  • Shareholding
  • Financials
  • CompanyCV
stock-summaryPrice Point
High/Low

1Day

52 Week

Valuation
Technical
Day's Volume

CASH

8.58 k (-45.95%) Volume

Shareholding (Aug 2026)

FII

0.47%

Held by 4 FIIs

DII

12.51%

Held by 0 DIIs

Promoter

37.23%

Why is Krishival Foods Ltd falling/rising?

02-Sep-2026

As of 01-Sep, Krishival Foods Ltd's stock price is at 410.40, showing a slight decline but positive trends with a 1.13% gain over the past week and an 18.29% increase year-to-date. Despite a minor drop today, the stock's overall performance and strong financial health suggest a positive long-term outlook.

As of 01-Sep, Krishival Foods Ltd's stock price is currently at 410.40, reflecting a slight decline of 0.6 points or 0.15%. Despite this minor decrease, the stock has shown positive performance over the past week, with a gain of 1.13%, and a notable increase of 5.71% over the past month. Year-to-date, the stock has risen significantly by 18.29%, contrasting with a decline of 9.71% in the benchmark Sensex.<BR><BR>Today's performance indicates that the stock has outperformed its sector by 0.86% and has experienced consecutive gains over the last two days, accumulating a total return of 0.91% during this period. Furthermore, Krishival Foods is trading above its moving averages across various time frames, including the 5-day, 20-day, 50-day, 100-day, and 200-day averages, which typically signals a bullish trend.<BR><BR>However, there are some negative indicators as well. The delivery volume has decreased by 19.4% compared to the 5-day average, suggesting a decline in investor participation. Despite this, the company maintains a strong financial position with a low debt-to-equity ratio of 0.02 times and has reported healthy growth in net sales and operating profit over the past quarters.<BR><BR>In summary, while the stock is currently experiencing a slight decline, its overall performance trends and financial health indicate a generally positive outlook, contributing to its rising trajectory in the longer term.

View full answer

Which are the latest news on Krishival Foods?

02-Sep-2026

Who are in the management team of Krishival Foods?

01-Sep-2026

The management team of Krishival Foods includes Chairperson & Managing Director Aparna Arun Morale, Executive Director & CEO Nana Prakash Mhaske, Executive Director & CFO Anant Pandurang Kulkarni, and three Independent Non-Executive Directors: Shailesh Kumar Jain, Neeraj Kulbhushan Taandon, and Sunil Kumar Agarwal.

The management team of Krishival Foods includes the following members:<BR><BR>1. **Aparna Arun Morale** - Chairperson & Managing Director<BR>2. **Nana Prakash Mhaske** - Executive Director & CEO<BR>3. **Anant Pandurang Kulkarni** - Executive Director & CFO<BR>4. **Shailesh Kumar Jain** - Independent Non-Executive Director<BR>5. **Neeraj Kulbhushan Taandon** - Independent Non-Executive Director<BR>6. **Sunil Kumar Agarwal** - Independent Non-Executive Director<BR><BR>If you have any more questions about the company or its operations, feel free to ask!

View full answer

What does Krishival Foods do?

01-Sep-2026

Krishival Foods Ltd processes raw cashew nuts into finished cashew kernels and operates in the Other Agricultural Products industry. As of June 2026, it reported net sales of 89 Cr and a net profit of 5 Cr, with a market cap of INR 1,164 Cr.

Overview: <BR>Krishival Foods Ltd is engaged in processing raw cashew nuts into finished cashew kernels with different grades and flavours, operating within the Other Agricultural Products industry and classified as a Micro Cap company.<BR><BR>History: <BR>Krishival Foods Ltd was incorporated on 21 March 2014. It transitioned from a Private Company to a Public Company, changing its name to Empyrean Cashews Limited on November 22, 2021, and further to Krishival Foods Limited on January 20, 2023. The most recent quarterly results reported net sales and net profit for June 2026.<BR><BR>Financial Snapshot: <BR>Net Sales: 89 Cr (Quarterly Results - Jun 2026) <BR>Net Profit: 5 Cr (Quarterly Results - Jun 2026) <BR>Market Cap: INR 1,164 Cr (Micro Cap)<BR><BR>Key Metrics: <BR>P/E: 53.00 <BR>Industry P/E: 43 <BR>Dividend Yield: 0.04% <BR>Debt-Equity: 0.04 <BR>Return on Equity: 11.15% <BR>Price to Book: 6.06 <BR><BR>Contact Details: <BR>Details: No Company Details Available <BR>Registrar Address: Not available.

View full answer

Who are the peers of the Krishival Foods?

01-Sep-2026

Krishival Foods' peers include GRM Overseas, Chamanlal Setia, AVT Natural Prod, and others. AVT Natural Prod leads in 1-year returns at 26.84%, while GRM Overseas has the lowest at -29.08%, with Krishival Foods at -4.03%.

Peers: The peers of Krishival Foods are GRM Overseas, Chamanlal Setia, AVT Natural Prod, Gulshan Polyols, Bombay Super Hyb, Regaal Resources, Sukhjit Starch, and KN Agri Resource.<BR><BR>Quality Snapshot: Excellent management risk is observed at Chamanlal Setia and AVT Natural Prod, while Average management risk is found at GRM Overseas, Gulshan Polyols, Bombay Super Hyb, Regaal Resources, Sukhjit Starch, and the rest. Growth is Excellent for Krishival Foods and Regaal Resources, while Below Average growth is noted for GRM Overseas, Chamanlal Setia, AVT Natural Prod, Gulshan Polyols, Sukhjit Starch, KN Agri Resource, and the rest. In terms of Capital Structure, Excellent ratings are given to Chamanlal Setia and AVT Natural Prod, while Below Average ratings are assigned to Gulshan Polyols and Regaal Resources, with Average ratings for Bombay Super Hyb and Sukhjit Starch.<BR><BR>Return Snapshot: The peer with the highest 1-year return is AVT Natural Prod at 26.84%, while the lowest is GRM Overseas at -29.08%, with Krishival Foods having a 1-year return of -4.03%, which is better than GRM Overseas but worse than AVT Natural Prod. Additionally, GRM Overseas and Regaal Resources have negative six-month returns.

View full answer

How big is Krishival Foods?

01-Sep-2026

As of 31st August, Krishival Foods Ltd has a market capitalization of 1,164.00 Cr, with recent net sales of 332.11 Cr and a net profit of 22.01 Cr.

As of 31st August, Krishival Foods Ltd has a market capitalization of 1,164.00 Cr and is classified as a Micro Cap company.<BR><BR>In the latest four quarters, Krishival Foods reported Net Sales of 332.11 Cr and a Net Profit of 22.01 Cr.<BR><BR>The latest annual period for the balance sheet is March 2025, with Shareholder's Funds amounting to 135.10 Cr and Total Assets of 172.76 Cr.

View full answer

Should I buy, sell or hold Krishival Foods Ltd?

13-Aug-2026

Are Krishival Foods Ltd latest results good or bad?

05-May-2026

Krishival Foods Ltd's latest results show strong revenue growth with record net sales of ₹102.07 crores, but profitability is concerning due to a sharp decline in operating margins and reliance on non-operating income, suggesting caution for investors.

Krishival Foods Ltd's latest results present a mixed picture. On one hand, the company achieved record net sales of ₹102.07 crores for Q4 FY26, reflecting a strong growth of 37.17% quarter-on-quarter and 38.42% year-on-year. This indicates robust demand for its cashew products and successful market penetration.<BR><BR>However, this impressive revenue growth is overshadowed by significant challenges in profitability. The operating margin has contracted sharply to 5.31%, the lowest level in eight quarters, down from 12.22% in the previous quarter. This decline raises concerns about the sustainability of the company's profitability amid rising operational pressures. Additionally, the consolidated net profit decreased by 11.40% quarter-on-quarter, although it did show a year-on-year increase of 32.68%.<BR><BR>The company's reliance on other income to bolster profitability is also troubling, as it constituted a substantial 68.34% of profit before tax, indicating that the core operations are underperforming. Furthermore, the return on equity stands at 9.37%, which is below industry standards, highlighting inefficiencies in generating returns from shareholder funds.<BR><BR>Overall, while the revenue figures are encouraging, the significant margin compression and reliance on non-operating income suggest that the results are not entirely positive. Investors may want to approach the stock with caution, considering the current operational challenges and high valuation metrics.

View full answer

When is the next results date for Krishival Foods Ltd?

01-Feb-2026

The next results date for Krishival Foods Ltd is 10 February 2026.

The next results date for Krishival Foods Ltd is scheduled for 10 February 2026.

View full answer

Is Krishival Foods technically bullish or bearish?

05-Dec-2025

As of December 4, 2025, Krishival Foods is in a neutral trend with mixed signals from key indicators, suggesting a consolidation phase rather than a clear bullish or bearish direction.

As of 4 December 2025, the technical trend for Krishival Foods has changed from mildly bullish to sideways. The current stance is neutral, reflecting a lack of clear direction. Key indicators include a weekly MACD showing no signal, a monthly RSI also without a signal, and Bollinger Bands indicating a sideways movement on both weekly and monthly time frames. The Dow Theory suggests a mildly bearish outlook on the weekly chart, while the On-Balance Volume shows a mildly bullish trend on the monthly chart. Overall, the mixed signals from these indicators suggest a consolidation phase rather than a definitive bullish or bearish trend.

View full answer

How has been the historical performance of Krishival Foods?

01-Dec-2025

Krishival Foods has experienced significant growth over the past five years, with net sales increasing from 28.13 Cr in Mar'21 to 202.23 Cr in Mar'25, and profit before tax rising from 1.02 Cr to 19.72 Cr. The company's total assets and liabilities also expanded substantially during this period, reflecting strong financial performance.

Answer:<BR>The historical performance of Krishival Foods shows significant growth over the past five years, particularly in net sales and profitability.<BR><BR>Breakdown:<BR>Krishival Foods has demonstrated a robust increase in net sales, rising from 28.13 Cr in Mar'21 to 202.23 Cr in Mar'25. This upward trend is mirrored in total operating income, which also grew from 28.13 Cr to 202.23 Cr during the same period. The company's total expenditure, excluding depreciation, increased from 24.93 Cr in Mar'21 to 181.07 Cr in Mar'25, reflecting higher raw material costs, which rose from 19.26 Cr to 139.01 Cr. Operating profit (PBDIT) has improved significantly, climbing from 3.65 Cr in Mar'21 to 25.23 Cr in Mar'25, although the operating profit margin has slightly decreased from 11.38% to 10.46%. Profit before tax also saw a substantial increase, moving from 1.02 Cr in Mar'21 to 19.72 Cr in Mar'25, with profit after tax following suit, rising from 0.67 Cr to 13.55 Cr. The company's total assets grew from 32.33 Cr in Mar'21 to 172.76 Cr in Mar'25, while total liabilities increased from 35.97 Cr to 172.76 Cr, indicating a significant expansion in both assets and liabilities. Cash flow from operating activities improved markedly, with a net cash inflow of 8.00 Cr in Mar'25 compared to a net outflow of 18.00 Cr in Mar'23. Overall, Krishival Foods has shown a strong upward trajectory in its financial performance over the years.

View full answer

Who are the top shareholders of the Krishival Foods?

17-Jul-2025

The top shareholders of Krishival Foods are Aparna Arun Morale with 34.48%, Syed Zafar Islam at 22.87%, and individual investors holding 44.11%. There are no pledged promoter holdings or mutual funds invested in the company, and foreign institutional investors hold a combined 0.87%.

The top shareholders of Krishival Foods include Aparna Arun Morale, who holds the largest stake at 34.48%. The highest public shareholder is Syed Zafar Islam, with a holding of 22.87%. Additionally, individual investors collectively hold 44.11% of the company. There are also three foreign institutional investors (FIIs) that hold a combined 0.87% of the shares. Notably, there are no pledged promoter holdings and no mutual funds currently invested in the company.

View full answer

Is Krishival Foods overvalued or undervalued?

09-Jun-2025

As of June 2, 2025, Krishival Foods is considered very expensive and overvalued with a PE ratio of 57.40 and an EV to EBITDA of 37.18, significantly higher than its peers, despite a strong 1-year stock return of 48.85% compared to the Sensex's 7.86%.

As of 2 June 2025, the valuation grade for Krishival Foods has moved from expensive to very expensive, indicating a significant shift in its perceived value. The company is currently considered overvalued. Key ratios include a PE ratio of 57.40, an EV to EBITDA ratio of 37.18, and a Price to Book Value of 6.36, all of which suggest a premium valuation compared to its peers.<BR><BR>In comparison to its industry peers, Jain Irrigation Systems Ltd. has a PE ratio of 122.97 and an EV to EBITDA of 11.19, while Indo US Bio-Tech Ltd. shows a PE of 20.35 and an EV to EBITDA of 18.26. These figures highlight that Krishival Foods is trading at a much higher valuation relative to its competitors. Additionally, the company's recent stock performance has significantly outpaced the Sensex, with a 1-year return of 48.85% compared to the Sensex's 7.86%, reinforcing the notion of overvaluation amidst strong market enthusiasm.

View full answer

Has Krishival Foods declared dividend?

06-Jun-2025

Yes, Krishival Foods Ltd has declared a 1% dividend with an ex-date of July 14, 2023. However, the dividend yield is 0%, and the company has shown strong price returns over various periods, particularly a 48.3% return over the past year.

Krishival Foods Ltd has declared a 1% dividend.<BR><BR>Dividend Details:<BR>- Percentage announced: 1%<BR>- Ex-date: 14 Jul 23<BR><BR>Dividend Yield: 0%<BR><BR>Total Returns by Period:<BR>In the last 6 months, Krishival Foods Ltd achieved a price return of 23.58% with a dividend return of 0%, resulting in a total return of 23.58%.<BR><BR>Over the past year, the company recorded a price return of 48.3% and a dividend return of 0%, leading to a total return of 48.3%.<BR><BR>In the 2-year period, the price return was 20.17% with a dividend return of 0.04%, culminating in a total return of 20.21%.<BR><BR>For the 3-year period, the price return stood at 13.76% with a dividend return of 0.04%, resulting in a total return of 13.8%.<BR><BR>Over the last 4 years, the price return was 0% and the dividend return was 0%, resulting in a total return of 0.0%.<BR><BR>In the 5-year period, both the price return and dividend return were 0%, leading to a total return of 0.0%.<BR><BR>Overall, while Krishival Foods has declared a dividend, the dividend yield remains at 0%. The total returns over various periods indicate a strong performance in price returns, particularly in the last year, despite the lack of significant dividend contributions.

View full answer
iScoreScore
Click here to find our call on this stock
Strong Sell
Sell
Hold
Buy
Strong Buy

Dashboard

1

Company has a Debt to Equity ratio (avg) of 0.02 times

 
2

Healthy long term growth as Net Sales has grown by an annual rate of 59.80% and Operating profit at 67.30%

 
3

The company has declared Positive results for the last 4 consecutive quarters

4

With ROE of 11.2, it has a Very Expensive valuation with a 6 Price to Book Value

stock-summaryMojo Parameters

Mojo Parameters

Loading Valuation Snapshot...

Stock DNA

stock-summary
Industry

Other Agricultural Products

stock-summary
Market cap

INR 1,167 Cr (Micro Cap)

stock-summary
P/E

53.00

stock-summary
Industry P/E

42

stock-summary
Dividend Yield

0.04%

stock-summary
Debt Equity

0.04

stock-summary
Return on Equity

11.15%

stock-summary
Price to Book

6.08

Revenue and Profits:
Net Sales:
89 Cr
(Quarterly Results - Jun 2026)
Net Profit:
5 Cr
stock-summaryTotal Returns
Total Returns (Price + Dividend) stock-summary
Dividend Yield (0.04%)
TimePeriod
Price Return
Dividend Return
Total Return
3 Months
2.77%
0%
2.77%
6 Months
30.21%
0%
30.21%
1 Year
-4.55%
0.04%
-4.51%
2 Years
82.91%
0.07%
82.98%
3 Years
52.43%
0.07%
52.5%
4 Years
50.1%
0.11%
50.21%
5 Years
0%
0%
0.0%

Latest dividend: 0.1899161803713528 per share ex-dividend date: Sep-18-2025

Risk Adjusted Returns v/s stock-summary
Returns Beta
Icon
Beta has not been calculated since enough price history is not available
stock-summaryNews & Corporate Actions

Announcements stock-summary

Icon
No announcement available

Corporate Actions stock-summary

stock-summary
BOARD MEETING

No Upcoming Board Meetings

stock-summary
DIVIDEND

Krishival Foods Ltd has declared 2% dividend, ex-date: 18 Sep 25

stock-summary
SPLITS

No Splits history available

stock-summary
BONUS

No Bonus history available

stock-summary
RIGHTS

Krishival Foods Ltd has announced 45:301 rights issue, ex-date: 17 Dec 25

stock-summaryKey Factors

Quality key factors stock-summary

Factor
Value
Sales Growth (5y)
59.80%
EBIT Growth (5y)
67.30%
EBIT to Interest (avg)
7.50
Debt to EBITDA (avg)
10.78
Net Debt to Equity (avg)
0.04
Sales to Capital Employed (avg)
1.20
Tax Ratio
21.53%
Dividend Payout Ratio
3.95%
Pledged Shares
0
Institutional Holding
12.98%
ROCE (avg)
5.39%
ROE (avg)
10.59%

Valuation key factors

Factor
Value
P/E Ratio
53
Industry P/E
42
Price to Book Value
6.04
EV to EBIT
50.34
EV to EBITDA
36.13
EV to Capital Employed
5.84
EV to Sales
3.53
PEG Ratio
1.70
Dividend Yield
0.04%
ROCE (Latest)
9.94%
ROE (Latest)
11.15%

Technicals key factors

Indicator
Weekly
Monthly
MACD
Bullish
RSI
No Signal
No Signal
Bollinger Bands
Bullish
Moving Averages
Bullish (Daily)
KST
Mildly Bearish
Dow Theory
Mildly Bullish
No Trend
OBV
Bullish
Bullish
stock-summary Technical Indicator Scale: Bearish, Mildly Bearish, Sideways, Mildly Bullish, Bullish  Turned 
stock-summaryShareholding
Shareholding Snapshot : Aug 2026stock-summary
Shareholding Compare (%holding) stock-summary
Majority shareholders

Non Institution

Pledged Promoter Holdings

None

Mutual Funds

Held by 0 Schemes

FIIs

Held by 4 FIIs (0.47%)

Promoter with highest holding

Aparna Sujit Bangar (34.85%)

Highest Public shareholder

Syed Zafar Islam (16%)

Individual Investors Holdings

35.37%

stock-summaryFinancial
[
  {
    "link": "quarterly",
    "btn_text": "All Quarterly Results",
    "header": "Quarterly Results Snapshot (Consolidated) - Jun'26 - QoQ",
    "rhs": [
      {
        "prefix": "Net Sales ",
        "suffix": "QoQ Growth in quarter ended Jun 2026 is -12.84% vs 37.17% in Mar 2026",
        "dir": -1
      },
      {
        "prefix": "Consolidated Net Profit ",
        "suffix": "QoQ Growth in quarter ended Jun 2026 is -11.76% vs -11.40% in Mar 2026",
        "dir": -1
      }
    ],
    "table": {
      "header": [
        "Jun'26",
        "Mar'26",
        "Change(%)"
      ],
      "body": [
        {
          "field": "Net Sales",
          "val1": "88.96",
          "val2": "102.07",
          "chgp": "-12.84%",
          "chgp_class": "negative"
        },
        {
          "field": "Operating Profit (PBDIT) excl Other Income",
          "val1": "10.48",
          "val2": "5.42",
          "chgp": "93.36%",
          "chgp_class": "positive"
        },
        {
          "field": "Interest",
          "val1": "1.40",
          "val2": "0.65",
          "chgp": "115.38%",
          "chgp_class": "negative"
        },
        {
          "field": "Exceptional Items",
          "val1": "0.00",
          "val2": "0.00",
          "chgp": "",
          "chgp_class": "neutral"
        },
        {
          "field": "Consolidate Net Profit",
          "val1": "4.80",
          "val2": "5.44",
          "chgp": "-11.76%",
          "chgp_class": "negative"
        },
        {
          "field": "Operating Profit Margin (Excl OI)",
          "val1": "11.78%",
          "val2": "5.31%",
          "chgp": "6.47%",
          "chgp_class": "positive"
        }
      ]
    }
  },
  {
    "link": "half-yearly",
    "btn_text": "All Half Yearly Results",
    "header": "Half Yearly Results Snapshot (Consolidated) - Sep'25",
    "rhs": [
      {
        "prefix": "Net Sales ",
        "suffix": " Growth in half year ended Sep 2025 is -9.54% vs 74.06% in Mar 2025",
        "dir": -1
      },
      {
        "prefix": "Consolidated Net Profit ",
        "suffix": " Growth in half year ended Sep 2025 is 88.57% vs -36.67% in Mar 2025",
        "dir": 1
      }
    ],
    "table": {
      "header": [
        "Sep'25",
        "Mar'25",
        "Change(%)"
      ],
      "body": [
        {
          "field": "Net Sales",
          "val1": "116.19",
          "val2": "128.44",
          "chgp": "-9.54%",
          "chgp_class": "negative"
        },
        {
          "field": "Operating Profit (PBDIT) excl Other Income",
          "val1": "12.83",
          "val2": "9.63",
          "chgp": "33.23%",
          "chgp_class": "positive"
        },
        {
          "field": "Interest",
          "val1": "1.28",
          "val2": "0.69",
          "chgp": "85.51%",
          "chgp_class": "negative"
        },
        {
          "field": "Exceptional Items",
          "val1": "0.00",
          "val2": "0.00",
          "chgp": "",
          "chgp_class": "neutral"
        },
        {
          "field": "Consolidate Net Profit",
          "val1": "9.90",
          "val2": "5.25",
          "chgp": "88.57%",
          "chgp_class": "positive"
        },
        {
          "field": "Operating Profit Margin (Excl OI)",
          "val1": "11.04%",
          "val2": "7.50%",
          "chgp": "3.54%",
          "chgp_class": "positive"
        }
      ]
    }
  },
  {
    "link": "nine-monthly",
    "btn_text": "All Nine Monthly Results",
    "header": "Nine Monthly Results Snapshot (Consolidated) - Dec'25",
    "rhs": [
      {
        "prefix": "Net Sales ",
        "suffix": "YoY Growth in nine months ended Dec 2025 is 48.34% vs -8.57% in Dec 2024",
        "dir": 1
      },
      {
        "prefix": "Consolidated Net Profit ",
        "suffix": "YoY Growth in nine months ended Dec 2025 is 69.92% vs -3.97% in Dec 2024",
        "dir": 1
      }
    ],
    "table": {
      "header": [
        "Dec'25",
        "Dec'24",
        "Change(%)"
      ],
      "body": [
        {
          "field": "Net Sales",
          "val1": "190.60",
          "val2": "128.49",
          "chgp": "48.34%",
          "chgp_class": "positive"
        },
        {
          "field": "Operating Profit (PBDIT) excl Other Income",
          "val1": "21.92",
          "val2": "14.52",
          "chgp": "50.96%",
          "chgp_class": "positive"
        },
        {
          "field": "Interest",
          "val1": "2.47",
          "val2": "0.78",
          "chgp": "216.67%",
          "chgp_class": "negative"
        },
        {
          "field": "Exceptional Items",
          "val1": "0.00",
          "val2": "0.00",
          "chgp": "",
          "chgp_class": "neutral"
        },
        {
          "field": "Consolidate Net Profit",
          "val1": "16.04",
          "val2": "9.44",
          "chgp": "69.92%",
          "chgp_class": "positive"
        },
        {
          "field": "Operating Profit Margin (Excl OI)",
          "val1": "11.50%",
          "val2": "11.30%",
          "chgp": "0.20%",
          "chgp_class": "positive"
        }
      ]
    }
  },
  {
    "link": "annual",
    "btn_text": "All Annual Results",
    "header": "Annual Results Snapshot (Consolidated) - Mar'26",
    "rhs": [
      {
        "prefix": "Net Sales ",
        "suffix": "YoY Growth in year ended Mar 2026 is 44.72% vs 97.11% in Mar 2025",
        "dir": -1
      },
      {
        "prefix": "Consolidated Net Profit ",
        "suffix": "YoY Growth in year ended Mar 2026 is 58.64% vs 44.81% in Mar 2025",
        "dir": 1
      }
    ],
    "table": {
      "header": [
        "Mar'26",
        "Mar'25",
        "Change(%)"
      ],
      "body": [
        {
          "field": "Net Sales",
          "val1": "292.67",
          "val2": "202.23",
          "chgp": "44.72%",
          "chgp_class": "positive"
        },
        {
          "field": "Operating Profit (PBDIT) excl Other Income",
          "val1": "27.33",
          "val2": "21.16",
          "chgp": "29.16%",
          "chgp_class": "positive"
        },
        {
          "field": "Interest",
          "val1": "3.12",
          "val2": "1.16",
          "chgp": "168.97%",
          "chgp_class": "negative"
        },
        {
          "field": "Exceptional Items",
          "val1": "0.00",
          "val2": "0.00",
          "chgp": "",
          "chgp_class": "neutral"
        },
        {
          "field": "Consolidate Net Profit",
          "val1": "21.48",
          "val2": "13.54",
          "chgp": "58.64%",
          "chgp_class": "positive"
        },
        {
          "field": "Operating Profit Margin (Excl OI)",
          "val1": "9.34%",
          "val2": "10.46%",
          "chgp": "-1.12%",
          "chgp_class": "negative"
        }
      ]
    }
  }
]

Quarterly Results Snapshot (Consolidated) - Jun'26 - QoQstock-summary

Jun'26
Mar'26
Change(%)
Net Sales
88.96
102.07
-12.84%
Operating Profit (PBDIT) excl Other Income
10.48
5.42
93.36%
Interest
1.40
0.65
115.38%
Exceptional Items
0.00
0.00
Consolidate Net Profit
4.80
5.44
-11.76%
Operating Profit Margin (Excl OI)
11.78%
5.31%
6.47%
Values in Rs Cr.
Direction Arrows
Net Sales

QoQ Growth in quarter ended Jun 2026 is -12.84% vs 37.17% in Mar 2026

Direction Arrows
Consolidated Net Profit

QoQ Growth in quarter ended Jun 2026 is -11.76% vs -11.40% in Mar 2026

Half Yearly Results Snapshot (Consolidated) - Sep'25stock-summary

Sep'25
Mar'25
Change(%)
Net Sales
116.19
128.44
-9.54%
Operating Profit (PBDIT) excl Other Income
12.83
9.63
33.23%
Interest
1.28
0.69
85.51%
Exceptional Items
0.00
0.00
Consolidate Net Profit
9.90
5.25
88.57%
Operating Profit Margin (Excl OI)
11.04%
7.50%
3.54%
Values in Rs Cr.
Direction Arrows
Net Sales

Growth in half year ended Sep 2025 is -9.54% vs 74.06% in Mar 2025

Direction Arrows
Consolidated Net Profit

Growth in half year ended Sep 2025 is 88.57% vs -36.67% in Mar 2025

Nine Monthly Results Snapshot (Consolidated) - Dec'25stock-summary

Dec'25
Dec'24
Change(%)
Net Sales
190.60
128.49
48.34%
Operating Profit (PBDIT) excl Other Income
21.92
14.52
50.96%
Interest
2.47
0.78
216.67%
Exceptional Items
0.00
0.00
Consolidate Net Profit
16.04
9.44
69.92%
Operating Profit Margin (Excl OI)
11.50%
11.30%
0.20%
Values in Rs Cr.
Direction Arrows
Net Sales

YoY Growth in nine months ended Dec 2025 is 48.34% vs -8.57% in Dec 2024

Direction Arrows
Consolidated Net Profit

YoY Growth in nine months ended Dec 2025 is 69.92% vs -3.97% in Dec 2024

Annual Results Snapshot (Consolidated) - Mar'26stock-summary

Mar'26
Mar'25
Change(%)
Net Sales
292.67
202.23
44.72%
Operating Profit (PBDIT) excl Other Income
27.33
21.16
29.16%
Interest
3.12
1.16
168.97%
Exceptional Items
0.00
0.00
Consolidate Net Profit
21.48
13.54
58.64%
Operating Profit Margin (Excl OI)
9.34%
10.46%
-1.12%
Values in Rs Cr.
Direction Arrows
Net Sales

YoY Growth in year ended Mar 2026 is 44.72% vs 97.11% in Mar 2025

Direction Arrows
Consolidated Net Profit

YoY Growth in year ended Mar 2026 is 58.64% vs 44.81% in Mar 2025

stock-summaryCompany CV
About Krishival Foods Ltd stock-summary
stock-summary
Krishival Foods Ltd
Micro Cap
Other Agricultural Products
Krishival Foods Limited, formerly known as Empyrean Cashews Private Limited was incorporated on 21 March 2014. Subsequently, it was converted from a Private Company to a Public Company and the name was changed to `Empyrean Cashews Limited' dated November 22, 2021 and further to Krishival Foods Limited on January 20, 2023 issued by RoC, Mumbai. The Company is engaged in processing raw cashew nuts into finished cashew kernels with different grades and flavours along with organic manure.
Company Coordinates stock-summary
Icon
No Company Details Available