
Compare Baba Arts with Similar Stocks
Dashboard
With a Operating Losses, the company has a Weak Long Term Fundamental Strength
- Company's ability to service its debt is weak with a poor EBIT to Interest (avg) ratio of 1.14
- The company has been able to generate a Return on Equity (avg) of 6.99% signifying low profitability per unit of shareholders funds
Risky - Negative EBITDA
Stock DNA
Media & Entertainment
INR 76 Cr (Micro Cap)
116.00
62
0.00%
-0.20
2.39%
2.79
Total Returns (Price + Dividend) 
Latest dividend: 0.125 per share ex-dividend date: Aug-27-2010
Risk Adjusted Returns v/s
Returns Beta

News

Baba Arts Ltd is Rated Sell by MarketsMOJO
Baba Arts Ltd is rated 'Sell' by MarketsMOJO, with this rating last updated on 13 February 2026. However, the analysis and financial metrics discussed here reflect the stock's current position as of 16 June 2026, providing investors with an up-to-date view of the company's fundamentals, valuation, financial trends, and technical outlook.
Read full news article
Baba Arts Ltd is Rated Sell by MarketsMOJO
Baba Arts Ltd is rated 'Sell' by MarketsMOJO, with this rating last updated on 13 Feb 2026. However, the analysis and financial metrics discussed here reflect the stock's current position as of 26 May 2026, providing investors with an up-to-date view of the company’s fundamentals, returns, and market standing.
Read full news article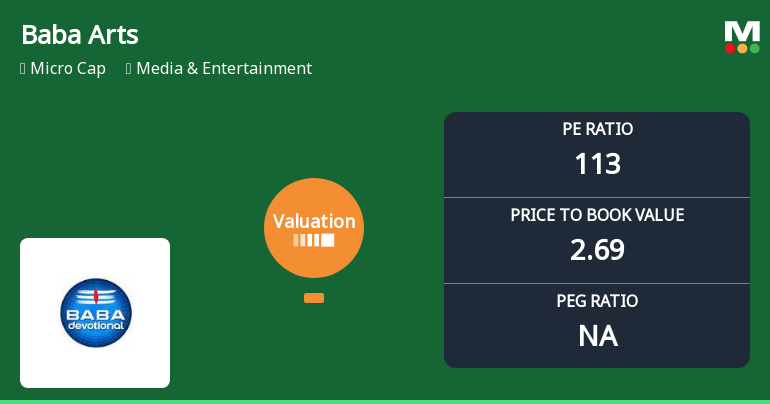
Baba Arts Ltd Valuation Shifts Highlight Elevated Risk Amid Market Outperformance
Baba Arts Ltd, a micro-cap player in the Media & Entertainment sector, has witnessed a marked shift in its valuation parameters, moving from a previously very expensive rating to a risky valuation status. Despite a recent uptick in share price, the company’s price-to-earnings (P/E) and price-to-book value (P/BV) ratios remain elevated relative to historical and peer averages, raising concerns about price attractiveness for investors.
Read full news article Announcements
Closure of Trading Window
23-Jun-2026 | Source : BSEWe hereby inform you that in accordance with the Companys Code of Conduct for Prevention of Insider Trading (the Code) read with applicable provisions of SEBI (Prohitbition of Insider Trading)(Amendment) Regulations 2018 the Trading Window for dealing in the Equity Shares of the Company by Directors promoters Designated Employees and specified connected persons as defined in the code shall remain closed with effect from Wednesday the 1st July 2026 till 48 hours after declaration of Unaudited Financial Results for the Quarter ended on 30th june 2026. The date of Board Meeting for declaration of the unaudited financial results of the Company for the quarter ended on 30th June 2026 will be intimated in due course.
Updates on Open Offer
08-Jun-2026 | Source : BSEBonanza Portfolio Ltd (Manager to the Offer) has submitted to BSE a copy of Pre-Offer Advertisement and Corrigendum to the Detailed Public Statement in accordance wtih the Regulation 18(7) of SEBI (SAST) Regulations 2011 for the attention of the Public Shareholders of Baba Arts Ltd (Target Company).
Recommendation of the Committee of Independent Director (IDC)
05-Jun-2026 | Source : BSEBonanza Portfolio Ltd (Manager to the Offer) has submitted to BSE a copy of Recommendation of the Committee of Independent Director (IDC) of Baba Arts Ltd (Target Company) on the Open Offer to the Shareholders of Baba Arts Ltd (Target Company) under Regulation 26(7) of the SEBI (SAST) Regulations 2011 including subsequent amendments thereto.
Corporate Actions

No Upcoming Board Meetings

Baba Arts Ltd has declared 25% dividend, ex-date: 27 Aug 10

Baba Arts Ltd has announced 1:4 stock split, ex-date: 29 Oct 09

Baba Arts Ltd has announced 1:1 bonus issue, ex-date: 29 Sep 10

No Rights history available
Quality key factors
Valuation key factors
Technicals key factors
 Technical Indicator Scale: Bearish, Mildly Bearish, Sideways, Mildly Bullish, Bullish Turned
 Shareholding Snapshot : Mar 2026
Shareholding Compare (%holding)
Promoters
None
Held by 0 Schemes
Held by 0 FIIs
Gordhan Prabhudas Tanwani (74.67%)
Karishma Const Investments Pvt Ltd (2.42%)
18.68%
Quarterly Results Snapshot (Standalone) - Mar'26 - QoQ

QoQ Growth in quarter ended Mar 2026 is 93.98% vs -24.65% in Dec 2025
QoQ Growth in quarter ended Mar 2026 is 100.00% vs -85.71% in Dec 2025
Half Yearly Results Snapshot (Standalone) - Sep'25
Growth in half year ended Sep 2025 is 340.12% vs -70.55% in Sep 2024

Growth in half year ended Sep 2025 is -30.56% vs 63.64% in Sep 2024
Nine Monthly Results Snapshot (Standalone) - Dec'25
YoY Growth in nine months ended Dec 2025 is 263.94% vs -74.98% in Dec 2024
YoY Growth in nine months ended Dec 2025 is -45.00% vs -50.00% in Dec 2024
Annual Results Snapshot (Standalone) - Mar'26
YoY Growth in year ended Mar 2026 is 167.44% vs -51.22% in Mar 2025
YoY Growth in year ended Mar 2026 is -54.86% vs -26.90% in Mar 2025
About Baba Arts Ltd

Company Coordinates


