
Compare Siti Networks with Similar Stocks
Dashboard
Weak Long Term Fundamental Strength as the company has not declared results in the last 6 months
- Poor long term growth as Operating profit has grown by an annual rate -192.93% of over the last 5 years
- The company has a negative book value of Rs 1,244.51 crore
- The company has reported losses and also has negative networth. This is not a good sign for the investors. Either company will have to raise fresh capital or report profits to sustain going forward
Flat results in Mar 25
Risky - Negative EBITDA
Stock DNA
Media & Entertainment
INR 30 Cr (Micro Cap)
NA (Loss Making)
16
0.00%
-0.35
15.82%
-0.03
Total Returns (Price + Dividend) 
Siti Networks for the last several years.
Risk Adjusted Returns v/s
Returns Beta

News

Siti Networks Ltd is Rated Strong Sell
Siti Networks Ltd is rated Strong Sell by MarketsMOJO. This rating was last updated on 18 Sep 2024, reflecting a significant reassessment of the stock’s outlook. However, the analysis and financial metrics presented here are based on the company’s current position as of 26 June 2026, providing investors with the latest insights into its performance and prospects.
Read full news article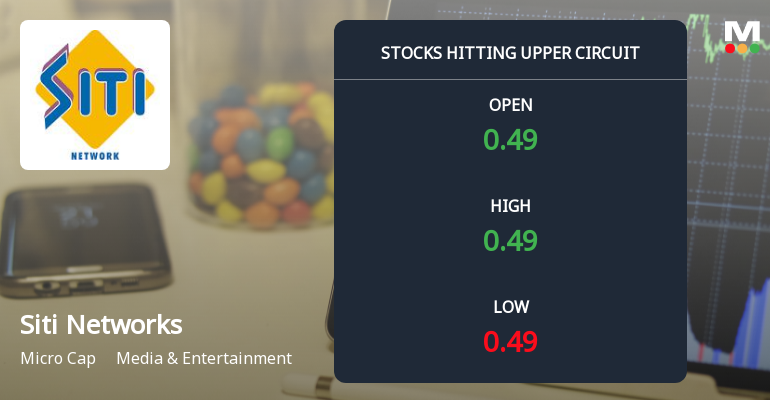
Siti Networks Ltd Locks at Upper Circuit With 2.94% Gain — Buyers Queue, Sellers Absent
At Rs 0.35, the buying was done — not because demand dried up, but because the exchange wouldn't let the stock go any higher. Siti Networks Ltd locked at its upper circuit of 2.94% on 24 Jun 2026, with buyers queuing and no sellers willing to part with shares.
Read full news article
Siti Networks Ltd Locks at Upper Circuit With 2.94% Gain — Buyers Queue, Sellers Absent
At Rs 0.35, the buying was done — not because demand dried up, but because the exchange wouldn't let the stock go any higher. Siti Networks Ltd locked at its upper circuit of 2.94% on 23 Jun 2026, with buyers queuing and no sellers willing to part with shares.
Read full news article Announcements
Siti Networks Limited - Updates
22-Oct-2019 | Source : NSESiti Networks Limited has informed the Exchange regarding 'Certificate under Regulation 74 (5) Of Securities and Exchange Board of India (Depositories and Participants) Regulations, 2018 depository as registered owner.
Outcome of Board Meeting
30-Aug-2019 | Source : NSE
| Siti Networks Limited has informed the Exchange regarding Outcome of Board Meeting held on August 30, 2019. |
Appointment
30-Aug-2019 | Source : NSE
| Siti Networks Limited has informed the Exchange regarding Appointment of Mr Anil Kumar Malhotra as Chief Executive Officer of the company w.e.f. September 01, 2019. |
Corporate Actions

No Upcoming Board Meetings

No Dividend history available

No Splits history available

No Bonus history available

Siti Networks Ltd has announced 109:100 rights issue, ex-date: 13 Aug 09
Quality key factors
Valuation key factors
Technicals key factors
 Technical Indicator Scale: Bearish, Mildly Bearish, Sideways, Mildly Bullish, Bullish Turned
 Shareholding Snapshot : Mar 2026
Shareholding Compare (%holding)
Non Institution
None
Held by 1 Schemes (0.0%)
Held by 5 FIIs (2.05%)
Global Fusion Limited (formerly Known As Essel Media Ventures Limited) (4.95%)
Hdfc Bank Limited (2.43%)
81.37%
Quarterly Results Snapshot (Consolidated) - Sep'25 - QoQ

QoQ Growth in quarter ended Sep 2025 is 9.39% vs -6.18% in Jun 2025
QoQ Growth in quarter ended Sep 2025 is 12.91% vs 10.73% in Jun 2025
Half Yearly Results Snapshot (Consolidated) - Sep'25

Growth in half year ended Sep 2025 is -7.21% vs -3.67% in Sep 2024
Growth in half year ended Sep 2025 is 12.96% vs 41.58% in Sep 2024
Nine Monthly Results Snapshot (Consolidated) - Dec'24
YoY Growth in nine months ended Dec 2024 is -6.98% vs -5.07% in Dec 2023
YoY Growth in nine months ended Dec 2024 is 32.76% vs -16.05% in Dec 2023
Annual Results Snapshot (Consolidated) - Mar'25
YoY Growth in year ended Mar 2025 is -8.72% vs -4.03% in Mar 2024
YoY Growth in year ended Mar 2025 is -13.86% vs 34.30% in Mar 2024
About Siti Networks Ltd

Company Coordinates


