
Compare Bajaj Electrical with Similar Stocks
Dashboard
Poor long term growth as Net Sales has grown by an annual rate of -0.54% and Operating profit at -46.72% over the last 5 years
The company has declared Negative results for the last 4 consecutive quarters
With ROE of -0.2, it has a Very Expensive valuation with a 2.3 Price to Book Value
Consistent Underperformance against the benchmark over the last 3 years
Stock DNA
Electronics & Appliances
INR 3,683 Cr (Small Cap)
NA (Loss Making)
106
0.96%
-0.23
-0.15%
2.25
Total Returns (Price + Dividend) 
Latest dividend: 3 per share ex-dividend date: Jul-18-2025
Risk Adjusted Returns v/s
Returns Beta

News

Bajaj Electricals Ltd is Rated Strong Sell
Bajaj Electricals Ltd is rated Strong Sell by MarketsMOJO, with this rating last updated on 22 Sep 2025. However, the analysis and financial metrics discussed here reflect the stock’s current position as of 14 June 2026, providing investors with an up-to-date view of the company’s performance and outlook.
Read full news article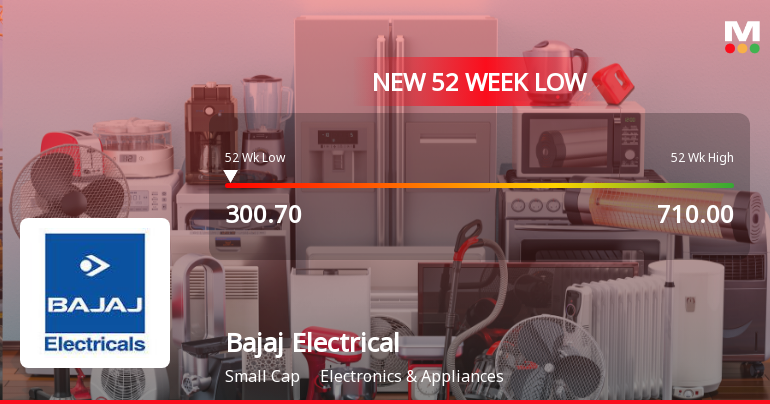
Bajaj Electricals Ltd Falls to 52-Week Low of Rs 300.7 as Sell-Off Deepens
A sharp decline in Bajaj Electricals Ltd has pushed the stock to a fresh 52-week low of Rs 300.7 on 11 Jun 2026, marking a significant 57.7% drop from its 52-week high of Rs 710. This downturn comes amid a broader market weakness and persistent negative financial results, raising questions about the stock’s near-term outlook.
Read full news article
Bajaj Electricals Ltd Falls to 52-Week Low of Rs 303.5 as Sell-Off Deepens
A sharp decline over recent sessions has dragged Bajaj Electricals Ltd to a fresh 52-week low of Rs 303.5 on 3 June 2026, marking a significant 57.3% drop from its 52-week high of Rs 710. This downturn comes amid a broader market weakness, but the stock’s underperformance far exceeds that of the benchmark indices.
Read full news article Announcements
Disclosure Under Regulation 30 Of Securities And Exchange Board Of India (Listing Obligations And Disclosures Requirements) Regulations 2015 As Amended
11-Jun-2026 | Source : BSEPlease refer to the enclosed file.
Disclosure Under Regulation 30 Of Securities And Exchange Board Of India (Listing Obligations And Disclosures Requirements) Regulations 2015 As Amended
09-Jun-2026 | Source : BSEPlease refer to the enclosed file.
Disclosures under Reg. 29(1) of SEBI (SAST) Regulations 2011
05-Jun-2026 | Source : BSEThe Exchange has received the disclosure under Regulation 29(1) of SEBI (Substantial Acquisition of Shares & Takeovers) Regulations 2011 for Kamalnayan Investment & Trading Pvt Ltd
Corporate Actions

No Upcoming Board Meetings

Bajaj Electricals Ltd has declared 150% dividend, ex-date: 17 Jul 26

Bajaj Electricals Ltd has announced 2:10 stock split, ex-date: 28 Jan 10

Bajaj Electricals Ltd has announced 1:1 bonus issue, ex-date: 28 Aug 07

Bajaj Electricals Ltd has announced 13:118 rights issue, ex-date: 05 Feb 20
Quality key factors
Valuation key factors
Technicals key factors
 Technical Indicator Scale: Bearish, Mildly Bearish, Sideways, Mildly Bullish, Bullish Turned
 Shareholding Snapshot : Mar 2026
Shareholding Compare (%holding)
Promoters
2.5484
Held by 10 Schemes (16.88%)
Held by 109 FIIs (6.51%)
None
Hdfc Small Cap Fund (8.13%)
9.35%
Quarterly Results Snapshot (Consolidated) - Mar'26 - YoY

YoY Growth in quarter ended Mar 2026 is -2.05% vs 6.51% in Mar 2025
YoY Growth in quarter ended Mar 2026 is -214.36% vs 101.47% in Mar 2025
Half Yearly Results Snapshot (Consolidated) - Sep'25
Growth in half year ended Sep 2025 is -4.47% vs 2.17% in Sep 2024
Growth in half year ended Sep 2025 is -73.74% vs -36.33% in Sep 2024
Nine Monthly Results Snapshot (Consolidated) - Dec'25
YoY Growth in nine months ended Dec 2025 is -9.55% vs 3.18% in Dec 2024
YoY Growth in nine months ended Dec 2025 is -131.37% vs -26.92% in Dec 2024
Annual Results Snapshot (Consolidated) - Mar'26
YoY Growth in year ended Mar 2026 is -7.59% vs 4.03% in Mar 2025
YoY Growth in year ended Mar 2026 is -168.10% vs 1.79% in Mar 2025
About Bajaj Electricals Ltd

Company Coordinates


