
Compare Orient Electric with Similar Stocks
Dashboard
Company has a Debt to Equity ratio (avg) of 0.01 times
Poor long term growth as Operating profit has grown by an annual rate -2.93% of over the last 5 years
Positive results in Mar 26
With ROE of 13.6, it has a Attractive valuation with a 5 Price to Book Value
High Institutional Holdings at 36.98%
Consistent Underperformance against the benchmark over the last 3 years
Stock DNA
Electronics & Appliances
INR 3,746 Cr (Small Cap)
36.00
56
0.84%
0.00
13.60%
4.98
Total Returns (Price + Dividend) 
Latest dividend: 0.7493744787322768 per share ex-dividend date: Jan-29-2026
Risk Adjusted Returns v/s
Returns Beta

News

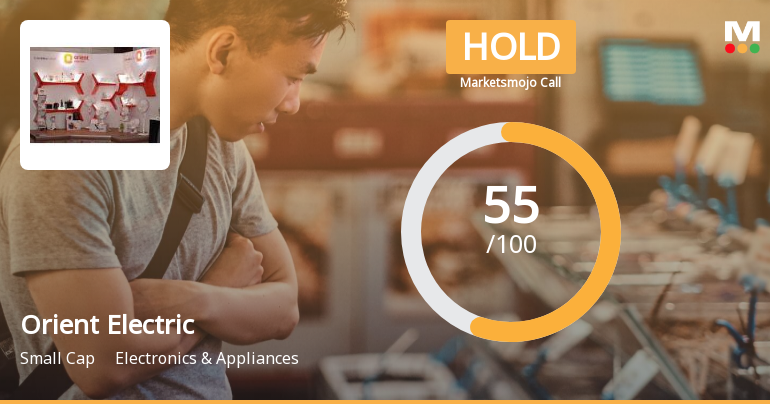
Orient Electric Ltd is Rated Hold
Orient Electric Ltd is rated Hold by MarketsMOJO, with this rating last updated on 13 April 2026. However, the analysis and financial metrics presented here reflect the stock's current position as of 20 June 2026, providing investors with the most up-to-date view of the company’s fundamentals, returns, and market standing.
Read full news article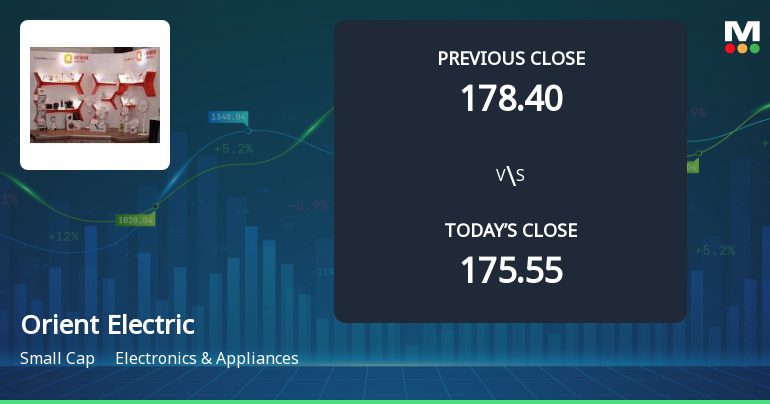
Orient Electric Ltd is Rated Hold
Orient Electric Ltd is rated 'Hold' by MarketsMOJO, with this rating last updated on 13 April 2026. However, the analysis and financial metrics discussed below reflect the stock's current position as of 09 June 2026, providing investors with an up-to-date view of the company’s fundamentals, valuation, financial trends, and technical outlook.
Read full news article Announcements
Announcement under Regulation 30 (LODR)-Analyst / Investor Meet - Intimation
16-Jun-2026 | Source : BSEPlease find enclosed intimation.
Announcement under Regulation 30 (LODR)-Analyst / Investor Meet - Intimation
15-Jun-2026 | Source : BSEPlease find enclosed intimation.
Announcement under Regulation 30 (LODR)-Newspaper Publication
12-Jun-2026 | Source : BSEPlease find enclosed copies of newspaper publication.
Corporate Actions

No Upcoming Board Meetings

Orient Electric Ltd has declared 75% dividend, ex-date: 10 Jul 26

No Splits history available

No Bonus history available

No Rights history available
Quality key factors
Valuation key factors
Technicals key factors
 Technical Indicator Scale: Bearish, Mildly Bearish, Sideways, Mildly Bullish, Bullish Turned
 Shareholding Snapshot : Mar 2026
Shareholding Compare (%holding)
Promoters
None
Held by 14 Schemes (31.6%)
Held by 55 FIIs (3.41%)
Central India Industries Limited (25.1%)
Icici Prudential Regular Savings Fund (7.1%)
10.92%
Quarterly Results Snapshot (Standalone) - Mar'26 - QoQ

QoQ Growth in quarter ended Mar 2026 is 4.61% vs 29.01% in Dec 2025
QoQ Growth in quarter ended Mar 2026 is 55.04% vs 115.42% in Dec 2025
Half Yearly Results Snapshot (Standalone) - Sep'25
Growth in half year ended Sep 2025 is 4.01% vs 11.20% in Sep 2024

Growth in half year ended Sep 2025 is 19.37% vs -35.03% in Sep 2024
Nine Monthly Results Snapshot (Standalone) - Dec'25
YoY Growth in nine months ended Dec 2025 is 6.56% vs 10.24% in Dec 2024
YoY Growth in nine months ended Dec 2025 is 6.95% vs -16.84% in Dec 2024
Annual Results Snapshot (Standalone) - Mar'26
YoY Growth in year ended Mar 2026 is 7.52% vs 10.01% in Mar 2025
YoY Growth in year ended Mar 2026 is 15.18% vs 10.55% in Mar 2025
About Orient Electric Ltd

Company Coordinates


