
Compare Bajaj Housing with Similar Stocks
Stock DNA
Housing Finance Company
INR 75,024 Cr (Mid Cap)
29.00
21
0.00%
4.60
11.41%
3.27
Total Returns (Price + Dividend) 
Bajaj Housing for the last several years.
Risk Adjusted Returns v/s
Returns Beta

News

Bajaj Housing Finance Ltd is Rated Sell
Bajaj Housing Finance Ltd is rated Sell by MarketsMOJO. This rating was last updated on 07 Nov 2025. However, the analysis and financial metrics discussed here reflect the company’s current position as of 13 June 2026, providing investors with an up-to-date view of the stock’s fundamentals, returns, and technical outlook.
Read full news article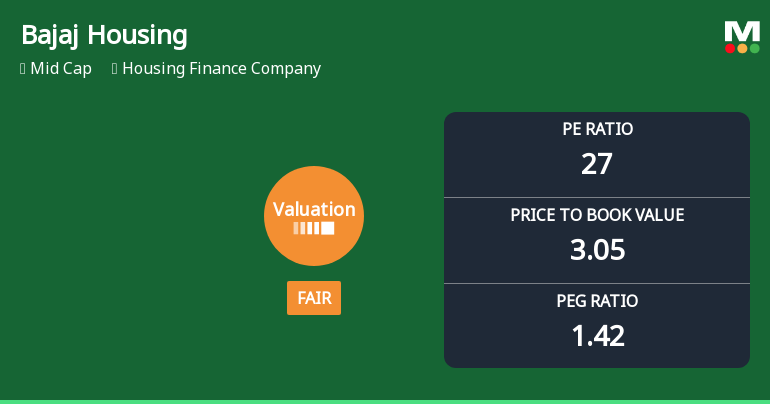
Bajaj Housing Finance Ltd Valuation Shifts Signal Renewed Price Attractiveness
Bajaj Housing Finance Ltd has witnessed a notable shift in its valuation parameters, moving from an expensive to a fair valuation grade amid a challenging market backdrop. This recalibration in price-to-earnings (P/E) and price-to-book value (P/BV) ratios reflects evolving investor sentiment and warrants a closer examination of the company’s relative attractiveness within the housing finance sector.
Read full news article
Bajaj Housing Finance Ltd is Rated Sell
Bajaj Housing Finance Ltd is currently rated Sell by MarketsMOJO, with this rating last updated on 07 Nov 2025. However, the analysis and financial metrics discussed here reflect the stock’s present position as of 02 June 2026, providing investors with the most recent and relevant data to assess the company’s outlook.
Read full news article Announcements
Announcement under Regulation 30 (LODR)-Issue of Securities
12-Jun-2026 | Source : BSEAllotment of secured redeemable non-convertible debentures on Private Placement basis.
Announcement under Regulation 30 (LODR)-Issue of Securities
05-Jun-2026 | Source : BSEAllotment of Secured Redeemable Non-Convertible Debentures on Private Placement basis.
Announcement under Regulation 30 (LODR)-Issue of Securities
27-May-2026 | Source : BSEAllotment of Secured Redeemable Non-Convertible Debentures on Private Placement basis
Corporate Actions

No Upcoming Board Meetings

No Dividend history available

No Splits history available

No Bonus history available

No Rights history available
Quality key factors
Valuation key factors
Technicals key factors
 Technical Indicator Scale: Bearish, Mildly Bearish, Sideways, Mildly Bullish, Bullish Turned
 Shareholding Snapshot : Mar 2026
Shareholding Compare (%holding)
Promoters
None
Held by 25 Schemes (0.35%)
Held by 85 FIIs (0.98%)
Bajaj Finance Limited (86.7%)
None
9.98%
Quarterly Results Snapshot (Standalone) - Mar'26 - QoQ

QoQ Growth in quarter ended Mar 2026 is 0.46% vs 5.19% in Dec 2025
QoQ Growth in quarter ended Mar 2026 is 0.65% vs 3.41% in Dec 2025
Half Yearly Results Snapshot (Standalone) - Sep'25
Growth in half year ended Sep 2025 is 16.28% vs 25.57% in Sep 2024

Growth in half year ended Sep 2025 is 19.26% vs 12.63% in Sep 2024
Nine Monthly Results Snapshot (Standalone) - Dec'25
YoY Growth in nine months ended Dec 2025 is 16.94% vs 25.69% in Dec 2024
YoY Growth in nine months ended Dec 2025 is 19.98% vs 16.77% in Dec 2024
Annual Results Snapshot (Standalone) - Mar'26
YoY Growth in year ended Mar 2026 is 16.61% vs 25.71% in Mar 2025
YoY Growth in year ended Mar 2026 is 18.38% vs 24.94% in Mar 2025
About Bajaj Housing Finance Ltd

Company Coordinates


