
Compare Balrampur Chini with Similar Stocks
Dashboard
Low ability to service debt as the company has a high Debt to EBITDA ratio of 4.28 times
- Low ability to service debt as the company has a high Debt to EBITDA ratio of 4.28 times
Poor long term growth as Operating profit has grown by an annual rate -1.29% of over the last 5 years
With ROCE of 7.7, it has a Expensive valuation with a 2.2 Enterprise value to Capital Employed
High Institutional Holdings at 38.23%
Market Beating performance in long term as well as near term
Total Returns (Price + Dividend) 
Latest dividend: 3.498516792033054 per share ex-dividend date: Nov-17-2025
Risk Adjusted Returns v/s
Returns Beta

News
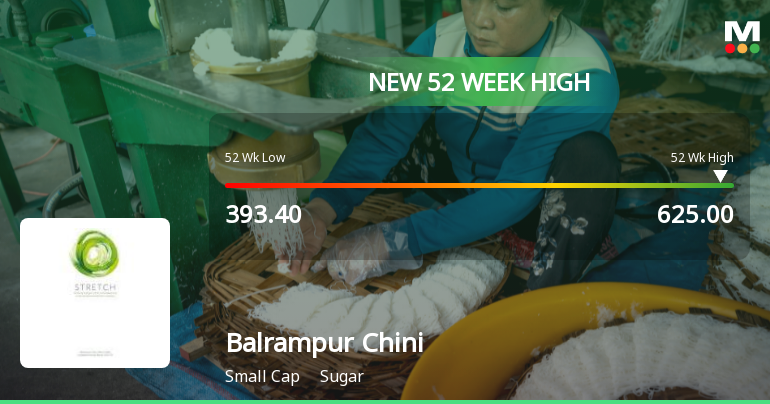
Broad-Based Technical Strength Lifts Balrampur Chini Mills Ltd to 52-Week High of Rs 625
With a decisive surge to Rs 625 on 21 Jul 2026, Balrampur Chini Mills Ltd has reached a fresh 52-week high, marking a significant milestone in its price momentum. This advance comes amid a backdrop of broad technical alignment and outperformance relative to its sector and the broader market.
Read full news article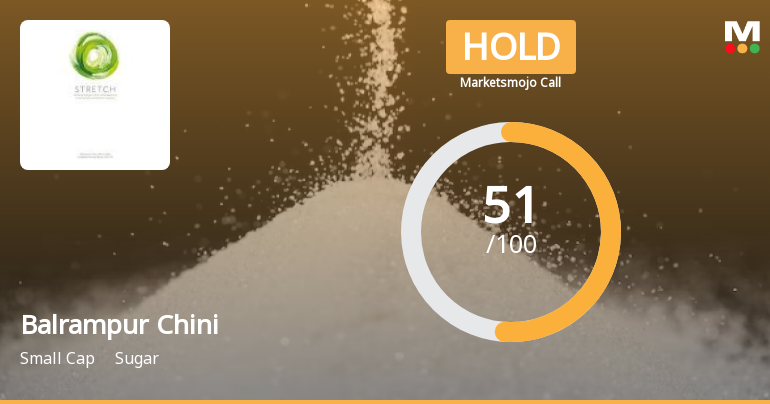
Balrampur Chini Mills Ltd is Rated Hold by MarketsMOJO
Balrampur Chini Mills Ltd is rated 'Hold' by MarketsMOJO, with this rating last updated on 06 July 2026. However, the analysis and financial metrics discussed here reflect the stock's current position as of 18 July 2026, providing investors with an up-to-date view of its fundamentals, returns, and market standing.
Read full news article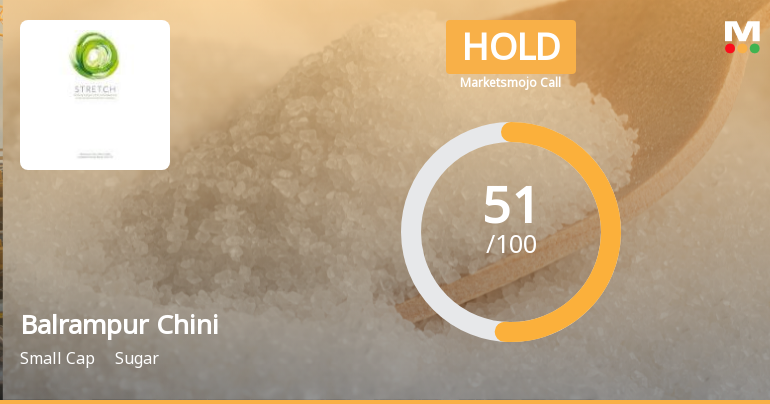
Balrampur Chini Mills Ltd Upgraded to Hold on Technical Improvements and Valuation Appeal
Balrampur Chini Mills Ltd has seen its investment rating upgraded from Sell to Hold, driven primarily by a marked improvement in technical indicators despite ongoing financial headwinds. The sugar sector heavyweight’s recent performance and valuation metrics present a nuanced picture, prompting analysts to reassess its outlook across quality, valuation, financial trend, and technical parameters.
Read full news article Announcements
Balrampur Chini Mills Limited - Other General Purpose
09-Dec-2019 | Source : NSEBalrampur Chini Mills Limited has informed the Exchange regarding Compliance under Regulation 23(9) of SEBI (Listing Obligations and Disclosure Requirements) Regulations, 2015.
Balrampur Chini Mills Limited - Analysts/Institutional Investor Meet/Con. Call Updates
03-Dec-2019 | Source : NSEBalrampur Chini Mills Limited has informed the Exchange regarding Analysts/Institutional Investor Meet/Con. Call Updates
Balrampur Chini Mills Limited - Analysts/Institutional Investor Meet/Con. Call Updates
26-Nov-2019 | Source : NSEBalrampur Chini Mills Limited has informed the Exchange regarding Analysts/Institutional Investor Meet/Con. Call Updates
Corporate Actions

No Upcoming Board Meetings

Balrampur Chini Mills Ltd has declared 350% dividend, ex-date: 17 Nov 25

No Splits history available

No Bonus history available

No Rights history available
Quality key factors
Valuation key factors
Technicals key factors
 Technical Indicator Scale: Bearish, Mildly Bearish, Sideways, Mildly Bullish, Bullish Turned
 Shareholding Snapshot : Jun 2026
Shareholding Compare (%holding)
Promoters
None
Held by 28 Schemes (25.54%)
Held by 129 FIIs (9.44%)
Saraogi Family Trust (vivek Saraogi-trustee) (24.83%)
Sbi Retirement Benefit Fund - Conservative Hybrid (6.28%)
14.81%
Quarterly Results Snapshot (Consolidated) - Mar'26 - YoY

YoY Growth in quarter ended Mar 2026 is 6.67% vs 4.84% in Mar 2025

YoY Growth in quarter ended Mar 2026 is -30.36% vs 12.65% in Mar 2025
Half Yearly Results Snapshot (Consolidated) - Sep'25
Growth in half year ended Sep 2025 is 18.15% vs -7.15% in Sep 2024
Growth in half year ended Sep 2025 is -23.21% vs -42.72% in Sep 2024
Nine Monthly Results Snapshot (Consolidated) - Dec'25
YoY Growth in nine months ended Dec 2025 is 19.31% vs -5.96% in Dec 2024
YoY Growth in nine months ended Dec 2025 is 5.34% vs -37.24% in Dec 2024
Annual Results Snapshot (Consolidated) - Mar'26
YoY Growth in year ended Mar 2026 is 15.80% vs -3.19% in Mar 2025
YoY Growth in year ended Mar 2026 is -13.38% vs -18.25% in Mar 2025
About Balrampur Chini Mills Ltd

Company Coordinates


