Bandaram Pharma

  • Market Cap: Micro Cap
  • Industry: Healthcare Services
  • ISIN: INE875N01036
  • NSEID:
  • BSEID: 524602
INR
20.93
2.38 (12.83%)
BSENSE

Sep 02, 12:00 PM

BSE+NSE Vol: 14.39 k

  • Price Points
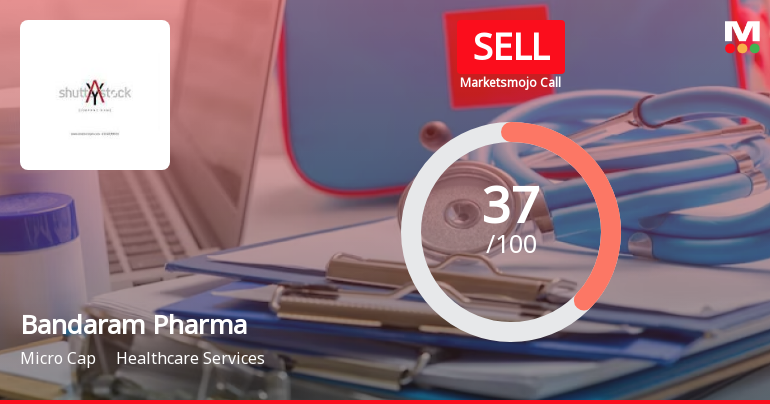
  • Score
  • Mojo Parameters
  • Total Return
  • News and Corporate Actions
  • Key factors
  • Shareholding
  • Financials
  • CompanyCV
stock-summaryPrice Point
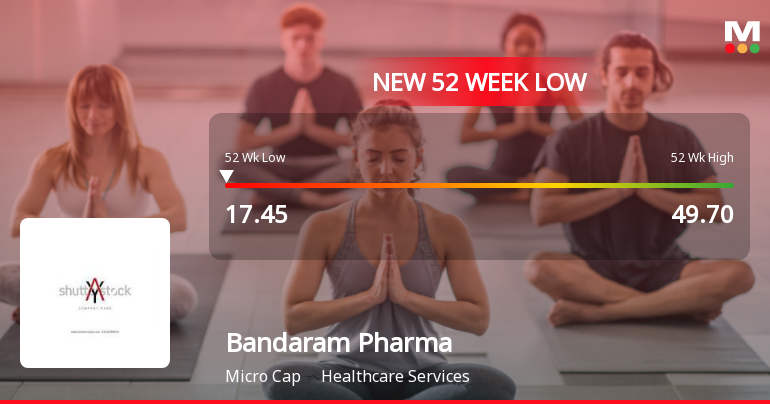
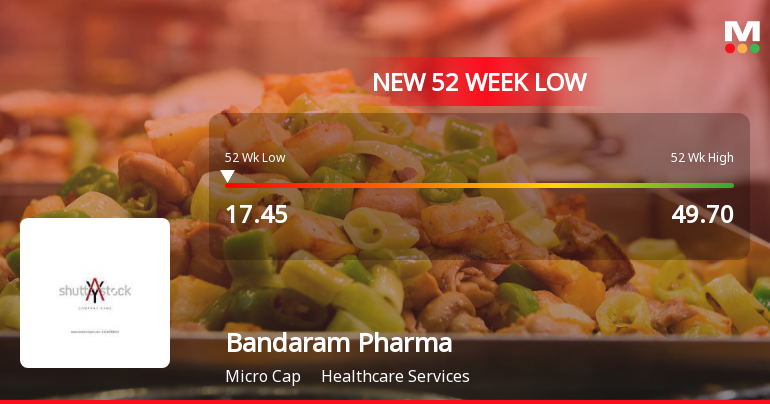
High/Low

1Day

52 Week

Valuation
Technical
Day's Volume

CASH

14.39 k (1,292.59%) Volume

Shareholding (Jun 2026)

FII

0.00%

Held by 0 FIIs

DII

0.00%

Held by 0 DIIs

Promoter

62.66%

Why is Bandaram Pharma Packtech Ltd falling/rising?

02-Sep-2026

As of 01-Sep, Bandaram Pharma Packtech Ltd's stock price is at 18.55, with a slight decrease of 0.05 (-0.27%). Despite recent short-term gains, the stock has a concerning long-term performance, with a -42.03% return over the past year and weak fundamentals, leading to cautious investor sentiment.

As of 01-Sep, Bandaram Pharma Packtech Ltd's stock price is currently at 18.55, reflecting a slight decrease of 0.05 (-0.27%). Despite this minor decline, the stock has shown some positive performance recently, having outperformed its sector by 2.63% today and experiencing a consecutive gain over the last two days with a total return of 6.11% during that period.<BR><BR>However, the stock's long-term performance has been concerning. Over the past year, it has generated a return of -42.03%, significantly underperforming the benchmark Sensex, which has only declined by 4.26% in the same timeframe. Additionally, the stock has a weak long-term fundamental strength, evidenced by an average Return on Capital Employed (ROCE) of 5.33% and a high Debt to EBITDA ratio of 8.23 times, indicating a low ability to service debt.<BR><BR>While the company has reported very positive results with a remarkable 3300% growth in net profit and positive results for the last three consecutive quarters, the overall sentiment is tempered by its substantial decline in stock price over the longer term. The stock is trading at a discount compared to its peers, but the significant drop in its value year-to-date (-37.69%) and over the past month (-9.95%) suggests that investors remain cautious. Furthermore, the falling investor participation, with a delivery volume decrease of 7.27% against the 5-day average, indicates a lack of confidence among traders.<BR><BR>In summary, while Bandaram Pharma Packtech Ltd has shown some short-term gains, the long-term decline in stock price, weak fundamental indicators, and reduced investor participation contribute to the overall perception of the stock's performance as falling.

View full answer

Who are in the management team of Bandaram Pharma?

01-Sep-2026

The management team of Bandaram Pharma includes Kishan Prasad Palayu (Chairman), Mahesh Kumar Vellaboyina, Sangam Venkateshwar Rao (both Non Executive Directors), Namrata Chadha (Non Executive Independent Director), and Shivarama Babu Velchuri (Executive Director).

The management team of Bandaram Pharma includes the following individuals:<BR><BR>1. Kishan Prasad Palayu - Chairman<BR>2. Mahesh Kumar Vellaboyina - Non Executive Director<BR>3. Sangam Venkateshwar Rao - Non Executive Director<BR>4. Namrata Chadha - Non Executive Independent Director<BR>5. Shivarama Babu Velchuri - Executive Director<BR><BR>If you have any more questions about the company or its operations, feel free to ask!

View full answer

What does Bandaram Pharma do?

01-Sep-2026

Bandaram Pharma Packtech Ltd operates in the healthcare services sector, focusing on recycled paper processing. It was incorporated in 1991 and reported net sales of 24 Cr and a net profit of 1 Cr for June 2026, with a market cap of INR 33 Cr.

Overview: <BR>Bandaram Pharma Packtech Ltd operates in the healthcare services industry, focusing on the processing and supply of recycled paper, and is categorized as a micro-cap company.<BR><BR>History: <BR>The company was incorporated on December 2, 1991, initially to manufacture latex gloves. It later ventured into the paper industry in 2022, discontinuing its computer sales and AMC business. The latest reported quarterly results are for June 2026.<BR><BR>Financial Snapshot: <BR>Net Sales: 24 Cr (Quarterly Results - Jun 2026) <BR>Net Profit: 1 Cr (Quarterly Results - Jun 2026) <BR>Market Cap: INR 33 Cr (Micro Cap)<BR><BR>Key Metrics: <BR>P/E: 34.00 <BR>Industry P/E: 112 <BR>Dividend Yield: 0.07% <BR>Debt-Equity: 0.87 <BR>Return on Equity: 1.23% <BR>Price to Book: 1.24 <BR><BR>Contact Details: <BR>Address: 601 5th Floor Oxford Towers, Old Airport Road Kodihalli Bangalore Karnataka : 560008 <BR>Email: contact@shivamedicare.com <BR>Website: http://www.bandaram.com

View full answer

Who are the peers of the Bandaram Pharma?

01-Sep-2026

Bandaram Pharma's peers include Shree Pacetronix, Amkay Products, KMS Medisurgi, N G Industries, Centenial Surgic, Deccan Healthcar, GKB Ophthalmics, Tejnaksh Health., and Chennai Meena. Bandaram Pharma has below-average management risk and a 1-year return of -41.87%, lower than its peers.

Peers: The peers of Bandaram Pharma are Shree Pacetronix, Amkay Products, KMS Medisurgi, N G Industries, Centenial Surgic, Deccan Healthcar, GKB Ophthalmics, Tejnaksh Health., and Chennai Meena.<BR><BR>Quality Snapshot: Excellent management risk is observed at Shree Pacetronix, Amkay Products, N G Industries, and Sunrest Lifescie, while Average management risk is found at KMS Medisurgi. Below Average management risk is noted for Centenial Surgic, Deccan Healthcar, GKB Ophthalmics, Bandaram Pharma, Tejnaksh Health., and Chennai Meena. Growth is Excellent at Bandaram Pharma and Good at Shree Pacetronix, Deccan Healthcar, and GKB Ophthalmics, while Below Average growth is seen at Amkay Products, KMS Medisurgi, N G Industries, Centenial Surgic, Tejnaksh Health., and the rest. Capital Structure is Good for Shree Pacetronix, Amkay Products, KMS Medisurgi, N G Industries, Deccan Healthcar, GKB Ophthalmics, and Tejnaksh Health., while Average is noted for Centenial Surgic, and Below Average for Bandaram Pharma.<BR><BR>Return Snapshot: The peer with the highest 1-year return is Amkay Products at 28.50%, while the lowest is Deccan Healthcar at -33.81%. Bandaram Pharma's 1-year return of -41.87% is lower than both. Additionally, the peers with negative six-month returns include Deccan Healthcar, N G Industries, and Bandaram Pharma.

View full answer

How big is Bandaram Pharma?

01-Sep-2026

As of 31st August, Bandaram Pharma Packtech Ltd has a market capitalization of 33.00 Cr, with recent net sales of 78.77 Cr and a net profit of 0.99 Cr.

As of 31st August, Bandaram Pharma Packtech Ltd has a market capitalization of 33.00 Cr, categorizing it as a Micro Cap company.<BR><BR>In the latest four quarters, the company reported Net Sales of 78.77 Cr and a Net Profit of 0.99 Cr.<BR><BR>The latest annual period for the balance sheet is March 2025, with Shareholder's Funds amounting to 12.65 Cr and Total Assets of 38.92 Cr.

View full answer

Should I buy, sell or hold Bandaram Pharma Packtech Ltd?

15-Aug-2026

When is the next results date for Bandaram Pharma Packtech Ltd?

07-Aug-2026

The next results date for Bandaram Pharma Packtech Ltd is 13 August 2026.

The next results date for Bandaram Pharma Packtech Ltd is scheduled for 13 August 2026.

View full answer

Are Bandaram Pharma Packtech Ltd latest results good or bad?

02-Jun-2026

Bandaram Pharma Packtech Ltd's latest results show strong revenue growth of 76.95% quarter-on-quarter and 209.31% year-on-year, but profitability has declined significantly, with net profit down 52.63% from the previous quarter. Overall, the financial metrics indicate more concerns than positives, suggesting caution for investors.

Bandaram Pharma Packtech Ltd's latest results present a mixed picture, leaning towards negative overall. In Q4 FY26, the company reported a significant revenue increase of 76.95% quarter-on-quarter and an impressive 209.31% year-on-year growth, reaching ₹26.26 crores. However, this strong top-line performance was overshadowed by a substantial decline in profitability. <BR><BR>The net profit fell to ₹0.09 crores, reflecting a 52.63% decrease from the previous quarter and a 40% drop year-on-year. Operating margins also deteriorated sharply, dropping to 3.12% from 6.81% in the prior quarter, indicating severe cost pressures and challenges in maintaining profitability despite higher sales.<BR><BR>The company's financial health is further questioned by low return ratios, with a return on equity (ROE) of just 5.15% and a return on capital employed (ROCE) of 5.75%. Additionally, the high debt levels and negative operating cash flow raise concerns about its financial stability.<BR><BR>Overall, while Bandaram Pharma has demonstrated strong revenue growth, the significant decline in profitability and operational challenges suggest that the latest results are more concerning than positive. Investors should be cautious given the current financial metrics and market positioning.

View full answer

How has been the historical performance of Bandaram Pharma?

03-Dec-2025

Bandaram Pharma has shown steady growth in net sales and profit over the past three years, with net sales increasing from 18.73 Cr in Mar'23 to 36.96 Cr in Mar'25, and profit after tax rising from 0.26 Cr to 0.99 Cr. Total assets and liabilities also grew significantly during this period, while cash flow from operating activities remained negative but stable.

Answer:<BR>The historical performance of Bandaram Pharma shows a steady growth in net sales and profit over the past three years.<BR><BR>Breakdown:<BR>Bandaram Pharma's net sales increased from 18.73 Cr in Mar'23 to 34.08 Cr in Mar'24, and further to 36.96 Cr in Mar'25, indicating a consistent upward trend. Total operating income mirrored this growth, reaching 36.96 Cr in Mar'25. The total expenditure also rose, from 17.57 Cr in Mar'23 to 34.14 Cr in Mar'25, primarily driven by raw material costs and employee expenses. Operating profit (PBDIT) improved from 1.35 Cr in Mar'23 to 2.91 Cr in Mar'25, while profit before tax rose from 0.33 Cr to 1.32 Cr in the same period. Profit after tax followed suit, increasing from 0.26 Cr in Mar'23 to 0.99 Cr in Mar'25. The company's total assets grew significantly from 20.17 Cr in Mar'23 to 38.92 Cr in Mar'25, alongside total liabilities which increased from 20.17 Cr to 38.92 Cr. Cash flow from operating activities remained negative but stable at -4.00 Cr in both Mar'24 and Mar'25, while cash flow from financing activities showed a positive trend, reaching 5.00 Cr in Mar'25. Overall, Bandaram Pharma has demonstrated solid growth in sales and profitability, alongside an increase in both assets and liabilities.

View full answer

Is Bandaram Pharma overvalued or undervalued?

29-Nov-2025

As of November 28, 2025, Bandaram Pharma is considered overvalued with a PE ratio of 216.00 and a valuation grade of attractive, despite strong short-term returns, due to negative year-to-date and one-year performance.

As of 28 November 2025, Bandaram Pharma's valuation grade has moved from very attractive to attractive, indicating a shift in perception regarding its worth. The company is currently considered overvalued, with a PE ratio of 216.00, a Price to Book Value of 3.71, and an EV to EBITDA of 30.28. These ratios suggest that the stock is trading at a premium compared to its earnings and book value.<BR><BR>In comparison to its peers, Bandaram Pharma's PE ratio is significantly higher than Lenskart Solutions at 241.34 and Poly Medicure at 54.51, both of which are also considered expensive. The PEG ratio of 51.30 further emphasizes the overvaluation, especially when compared to the industry standards. While Bandaram Pharma has shown strong short-term returns, outperforming the Sensex in the past week and month, its year-to-date and one-year returns are negative, which adds to the concern regarding its current valuation.

View full answer

Who are the top shareholders of the Bandaram Pharma?

17-Jul-2025

The top shareholder of Bandaram Pharma is B. Deepak Reddy, holding 39.38% of the shares, with no pledged promoter holdings. The highest public shareholder is Sanivarapu Jhansi at 6.54%, while individual investors collectively own 23.74%.

The top shareholders of Bandaram Pharma include the promoters, with B. Deepak Reddy holding the largest stake at 39.38%. There are no pledged promoter holdings, and the company does not have any mutual funds or foreign institutional investors (FIIs) holding shares. The highest public shareholder is Sanivarapu Jhansi, who owns 6.54% of the shares. Additionally, individual investors collectively hold 23.74% of the company's shares.

View full answer

What is the technical trend for Bandaram Pharma?

09-Jun-2025

As of May 5, 2025, Bandaram Pharma's technical trend has shifted to a bearish stance with moderate strength, indicated by bearish signals from the MACD, Bollinger Bands, and moving averages, alongside a bearish monthly RSI.

As of 5 May 2025, the technical trend for Bandaram Pharma has changed from mildly bearish to bearish. The current stance is bearish with moderate strength. Key indicators driving this assessment include the weekly MACD and Bollinger Bands both signaling bearish trends, alongside a bearish reading from the daily moving averages. The monthly RSI also indicates bearish momentum, while the KST and Dow Theory show mildly bearish conditions on a monthly basis. Overall, the combination of these indicators suggests a prevailing bearish sentiment in the market for Bandaram Pharma.

View full answer

Has Bandaram Pharma declared dividend?

06-Jun-2025

Bandaram Pharma Packtech Ltd has declared a 1% dividend, amounting to 0.1 per share, with an ex-date of September 20, 2024. Total returns have varied significantly across periods, with a 5-year total return of 166.14%, despite some shorter periods showing negative returns.

Bandaram Pharma Packtech Ltd has declared a 1% dividend.<BR><BR>Dividend Details:<BR>- Percentage announced: 1%<BR>- Amount per share: 0.1<BR>- Ex-date: 20 Sep 2024<BR><BR>Dividend Yield: 0.05%.<BR><BR>Total Returns by Period:<BR>In the 6-month period, the price return was -15.87%, with a dividend return of 0%, resulting in a total return of -15.87%.<BR><BR>Over the 1-year period, the price return was 7.69%, the dividend return was 0.30%, leading to a total return of 7.99%.<BR><BR>For the 2-year period, the price return was -49.75%, with no dividend return, resulting in a total return of -49.75%.<BR><BR>In the 3-year period, the price return was 0%, and there was no dividend return, leading to a total return of 0.0%.<BR><BR>During the 4-year period, the price return was 165.45%, with no dividend return, resulting in a total return of 165.45%.<BR><BR>For the 5-year period, the price return was 165.45%, with a dividend return of 0.69%, leading to a total return of 166.14%.<BR><BR>Overall, while Bandaram Pharma has declared a dividend, the total returns over various periods show significant variability, with some periods reflecting substantial gains, particularly over the longer term, despite certain periods showing negative returns.

View full answer
iScoreScore
Click here to find our call on this stock
Strong Sell
Sell
Hold
Buy
Strong Buy

Dashboard

1

Weak Long Term Fundamental Strength with an average Return on Capital Employed (ROCE) of 5.33%

  • Low ability to service debt as the company has a high Debt to EBITDA ratio of 8.23 times
2

Below par performance in long term as well as near term

stock-summaryMojo Parameters

Mojo Parameters

Loading Valuation Snapshot...

Stock DNA

stock-summary
Industry

Healthcare Services

stock-summary
Market cap

INR 36 Cr (Micro Cap)

stock-summary
P/E

35.00

stock-summary
Industry P/E

116

stock-summary
Dividend Yield

0.07%

stock-summary
Debt Equity

0.87

stock-summary
Return on Equity

1.23%

stock-summary
Price to Book

1.28

Revenue and Profits:
Net Sales:
24 Cr
(Quarterly Results - Jun 2026)
Net Profit:
1 Cr
stock-summaryTotal Returns
Total Returns (Price + Dividend) stock-summary
Dividend Yield (0.07%)
TimePeriod
Price Return
Dividend Return
Total Return
3 Months
-30.07%
0%
-30.07%
6 Months
-29.05%
0%
-29.05%
1 Year
-34.41%
0.29%
-34.12%
2 Years
-53.44%
0.53%
-52.91%
3 Years
0%
0.72%
0.72%
4 Years
0%
0%
0.0%
5 Years
0%
0%
0.0%

Latest dividend: 0.1 per share ex-dividend date: Sep-22-2025

Risk Adjusted Returns v/s stock-summary
Returns Beta
Icon
Beta has not been calculated since enough price history is not available
stock-summaryNews & Corporate Actions

Announcements stock-summary

Announcement under Regulation 30 (LODR)-Change in Management

13-Aug-2026 | Source : BSE

Change in Management

Un-Audited Financial Results (Standalone & Consolidated) For The Quater Ended 30.06.2026

13-Aug-2026 | Source : BSE

Un-Audited Financial Results (Standalone & Consolidated) for Quater ended 30.06.2026

Board Meeting Intimation for Board Meeting To Be Held On 13.08.2026

06-Aug-2026 | Source : BSE

Bandaram Pharma Packtech Ltdhas informed BSE that the meeting of the Board of Directors of the Company is scheduled on 13/08/2026 inter alia to consider and approve 1. Un-Audited standalone and consolidated financial results along with Limited Review Report for the quarter ended 30.06.2026.

Corporate Actions stock-summary

stock-summary
BOARD MEETING

No Upcoming Board Meetings

stock-summary
DIVIDEND

Bandaram Pharma Packtech Ltd has declared 1% dividend, ex-date: 22 Sep 25

stock-summary
SPLITS

No Splits history available

stock-summary
BONUS

No Bonus history available

stock-summary
RIGHTS

Bandaram Pharma Packtech Ltd has announced 3:1 rights issue, ex-date: 30 Jun 23

stock-summaryKey Factors

Quality key factors stock-summary

Factor
Value
Sales Growth (5y)
40.68%
EBIT Growth (5y)
53.25%
EBIT to Interest (avg)
1.79
Debt to EBITDA (avg)
7.75
Net Debt to Equity (avg)
0.87
Sales to Capital Employed (avg)
1.21
Tax Ratio
28.48%
Dividend Payout Ratio
12.07%
Pledged Shares
0
Institutional Holding
0.00%
ROCE (avg)
4.85%
ROE (avg)
4.21%

Valuation key factors

Factor
Value
P/E Ratio
35
Industry P/E
116
Price to Book Value
1.28
EV to EBIT
18.56
EV to EBITDA
15.03
EV to Capital Employed
1.15
EV to Sales
0.73
PEG Ratio
NA
Dividend Yield
0.07%
ROCE (Latest)
4.50%
ROE (Latest)
1.23%

Technicals key factors

Indicator
Weekly
Monthly
MACD
Bearish
Bearish
RSI
No Signal
No Signal
Bollinger Bands
Mildly Bearish
Bearish
Moving Averages
Bearish (Daily)
KST
Bearish
Bearish
Dow Theory
Mildly Bearish
No Trend
stock-summary Technical Indicator Scale: Bearish, Mildly Bearish, Sideways, Mildly Bullish, Bullish  Turned 
stock-summaryShareholding
Shareholding Snapshot : Jun 2026stock-summary
Shareholding Compare (%holding) stock-summary
Majority shareholders

Promoters

Pledged Promoter Holdings

None

Mutual Funds

Held by 0 Schemes

FIIs

Held by 0 FIIs

Promoter with highest holding

Deepak Reddy B (35.28%)

Highest Public shareholder

Sanivarapu Jhansi (4.37%)

Individual Investors Holdings

36.2%

stock-summaryFinancial
[
  {
    "link": "quarterly",
    "btn_text": "All Quarterly Results",
    "header": "Quarterly Results Snapshot (Consolidated) - Jun'26 - YoY",
    "rhs": [
      {
        "prefix": "Net Sales ",
        "suffix": "YoY Growth in quarter ended Jun 2026 is 195.68% vs -28.76% in Jun 2025",
        "dir": 1
      },
      {
        "prefix": "Consolidated Net Profit ",
        "suffix": "YoY Growth in quarter ended Jun 2026 is 3,300.00% vs -88.89% in Jun 2025",
        "dir": 1
      }
    ],
    "table": {
      "header": [
        "Jun'26",
        "Jun'25",
        "Change(%)"
      ],
      "body": [
        {
          "field": "Net Sales",
          "val1": "23.95",
          "val2": "8.10",
          "chgp": "195.68%",
          "chgp_class": "positive"
        },
        {
          "field": "Operating Profit (PBDIT) excl Other Income",
          "val1": "1.54",
          "val2": "0.62",
          "chgp": "148.39%",
          "chgp_class": "positive"
        },
        {
          "field": "Interest",
          "val1": "0.42",
          "val2": "0.46",
          "chgp": "-8.70%",
          "chgp_class": "positive"
        },
        {
          "field": "Exceptional Items",
          "val1": "0.00",
          "val2": "0.00",
          "chgp": "",
          "chgp_class": "neutral"
        },
        {
          "field": "Consolidate Net Profit",
          "val1": "0.68",
          "val2": "0.02",
          "chgp": "3,300.00%",
          "chgp_class": "positive"
        },
        {
          "field": "Operating Profit Margin (Excl OI)",
          "val1": "6.43%",
          "val2": "7.65%",
          "chgp": "-1.22%",
          "chgp_class": "negative"
        }
      ]
    }
  },
  {
    "link": "half-yearly",
    "btn_text": "All Half Yearly Results",
    "header": "Half Yearly Results Snapshot (Consolidated) - Sep'25",
    "rhs": [
      {
        "prefix": "Net Sales ",
        "suffix": " Growth in half year ended Sep 2025 is 18.19% vs 8.84% in Sep 2024",
        "dir": 1
      },
      {
        "prefix": "Consolidated Net Profit ",
        "suffix": " Growth in half year ended Sep 2025 is -87.06% vs 347.37% in Sep 2024",
        "dir": -1
      }
    ],
    "table": {
      "header": [
        "Sep'25",
        "Sep'24",
        "Change(%)"
      ],
      "body": [
        {
          "field": "Net Sales",
          "val1": "21.83",
          "val2": "18.47",
          "chgp": "18.19%",
          "chgp_class": "positive"
        },
        {
          "field": "Operating Profit (PBDIT) excl Other Income",
          "val1": "1.09",
          "val2": "1.62",
          "chgp": "-32.72%",
          "chgp_class": "negative"
        },
        {
          "field": "Interest",
          "val1": "0.71",
          "val2": "0.47",
          "chgp": "51.06%",
          "chgp_class": "negative"
        },
        {
          "field": "Exceptional Items",
          "val1": "0.00",
          "val2": "0.00",
          "chgp": "",
          "chgp_class": "neutral"
        },
        {
          "field": "Consolidate Net Profit",
          "val1": "0.11",
          "val2": "0.85",
          "chgp": "-87.06%",
          "chgp_class": "negative"
        },
        {
          "field": "Operating Profit Margin (Excl OI)",
          "val1": "4.99%",
          "val2": "8.77%",
          "chgp": "-3.78%",
          "chgp_class": "negative"
        }
      ]
    }
  },
  {
    "link": "nine-monthly",
    "btn_text": "All Nine Monthly Results",
    "header": "Nine Monthly Results Snapshot (Consolidated) - Dec'25",
    "rhs": [
      {
        "prefix": "Net Sales ",
        "suffix": "YoY Growth in nine months ended Dec 2025 is 28.80% vs 17.02% in Dec 2024",
        "dir": 1
      },
      {
        "prefix": "Consolidated Net Profit ",
        "suffix": "YoY Growth in nine months ended Dec 2025 is -64.29% vs 170.97% in Dec 2024",
        "dir": -1
      }
    ],
    "table": {
      "header": [
        "Dec'25",
        "Dec'24",
        "Change(%)"
      ],
      "body": [
        {
          "field": "Net Sales",
          "val1": "36.67",
          "val2": "28.47",
          "chgp": "28.80%",
          "chgp_class": "positive"
        },
        {
          "field": "Operating Profit (PBDIT) excl Other Income",
          "val1": "2.10",
          "val2": "2.28",
          "chgp": "-7.89%",
          "chgp_class": "negative"
        },
        {
          "field": "Interest",
          "val1": "1.04",
          "val2": "0.71",
          "chgp": "46.48%",
          "chgp_class": "negative"
        },
        {
          "field": "Exceptional Items",
          "val1": "0.00",
          "val2": "0.00",
          "chgp": "",
          "chgp_class": "neutral"
        },
        {
          "field": "Consolidate Net Profit",
          "val1": "0.30",
          "val2": "0.84",
          "chgp": "-64.29%",
          "chgp_class": "negative"
        },
        {
          "field": "Operating Profit Margin (Excl OI)",
          "val1": "5.73%",
          "val2": "8.01%",
          "chgp": "-2.28%",
          "chgp_class": "negative"
        }
      ]
    }
  },
  {
    "link": "annual",
    "btn_text": "All Annual Results",
    "header": "Annual Results Snapshot (Consolidated) - Mar'26",
    "rhs": [
      {
        "prefix": "Net Sales ",
        "suffix": "YoY Growth in year ended Mar 2026 is 70.24% vs 8.45% in Mar 2025",
        "dir": 1
      },
      {
        "prefix": "Consolidated Net Profit ",
        "suffix": "YoY Growth in year ended Mar 2026 is -18.18% vs -42.11% in Mar 2025",
        "dir": 1
      }
    ],
    "table": {
      "header": [
        "Mar'26",
        "Mar'25",
        "Change(%)"
      ],
      "body": [
        {
          "field": "Net Sales",
          "val1": "62.92",
          "val2": "36.96",
          "chgp": "70.24%",
          "chgp_class": "positive"
        },
        {
          "field": "Operating Profit (PBDIT) excl Other Income",
          "val1": "2.90",
          "val2": "2.82",
          "chgp": "2.84%",
          "chgp_class": "positive"
        },
        {
          "field": "Interest",
          "val1": "1.51",
          "val2": "0.61",
          "chgp": "147.54%",
          "chgp_class": "negative"
        },
        {
          "field": "Exceptional Items",
          "val1": "0.00",
          "val2": "0.00",
          "chgp": "",
          "chgp_class": "neutral"
        },
        {
          "field": "Consolidate Net Profit",
          "val1": "0.45",
          "val2": "0.55",
          "chgp": "-18.18%",
          "chgp_class": "negative"
        },
        {
          "field": "Operating Profit Margin (Excl OI)",
          "val1": "4.61%",
          "val2": "7.63%",
          "chgp": "-3.02%",
          "chgp_class": "negative"
        }
      ]
    }
  }
]

Quarterly Results Snapshot (Consolidated) - Jun'26 - YoYstock-summary

Jun'26
Jun'25
Change(%)
Net Sales
23.95
8.10
195.68%
Operating Profit (PBDIT) excl Other Income
1.54
0.62
148.39%
Interest
0.42
0.46
-8.70%
Exceptional Items
0.00
0.00
Consolidate Net Profit
0.68
0.02
3,300.00%
Operating Profit Margin (Excl OI)
6.43%
7.65%
-1.22%
Values in Rs Cr.
Direction Arrows
Net Sales

YoY Growth in quarter ended Jun 2026 is 195.68% vs -28.76% in Jun 2025

Direction Arrows
Consolidated Net Profit

YoY Growth in quarter ended Jun 2026 is 3,300.00% vs -88.89% in Jun 2025

Half Yearly Results Snapshot (Consolidated) - Sep'25stock-summary

Sep'25
Sep'24
Change(%)
Net Sales
21.83
18.47
18.19%
Operating Profit (PBDIT) excl Other Income
1.09
1.62
-32.72%
Interest
0.71
0.47
51.06%
Exceptional Items
0.00
0.00
Consolidate Net Profit
0.11
0.85
-87.06%
Operating Profit Margin (Excl OI)
4.99%
8.77%
-3.78%
Values in Rs Cr.
Direction Arrows
Net Sales

Growth in half year ended Sep 2025 is 18.19% vs 8.84% in Sep 2024

Direction Arrows
Consolidated Net Profit

Growth in half year ended Sep 2025 is -87.06% vs 347.37% in Sep 2024

Nine Monthly Results Snapshot (Consolidated) - Dec'25stock-summary

Dec'25
Dec'24
Change(%)
Net Sales
36.67
28.47
28.80%
Operating Profit (PBDIT) excl Other Income
2.10
2.28
-7.89%
Interest
1.04
0.71
46.48%
Exceptional Items
0.00
0.00
Consolidate Net Profit
0.30
0.84
-64.29%
Operating Profit Margin (Excl OI)
5.73%
8.01%
-2.28%
Values in Rs Cr.
Direction Arrows
Net Sales

YoY Growth in nine months ended Dec 2025 is 28.80% vs 17.02% in Dec 2024

Direction Arrows
Consolidated Net Profit

YoY Growth in nine months ended Dec 2025 is -64.29% vs 170.97% in Dec 2024

Annual Results Snapshot (Consolidated) - Mar'26stock-summary

Mar'26
Mar'25
Change(%)
Net Sales
62.92
36.96
70.24%
Operating Profit (PBDIT) excl Other Income
2.90
2.82
2.84%
Interest
1.51
0.61
147.54%
Exceptional Items
0.00
0.00
Consolidate Net Profit
0.45
0.55
-18.18%
Operating Profit Margin (Excl OI)
4.61%
7.63%
-3.02%
Values in Rs Cr.
Direction Arrows
Net Sales

YoY Growth in year ended Mar 2026 is 70.24% vs 8.45% in Mar 2025

Direction Arrows
Consolidated Net Profit

YoY Growth in year ended Mar 2026 is -18.18% vs -42.11% in Mar 2025

stock-summaryCompany CV
About Bandaram Pharma Packtech Ltd stock-summary
stock-summary
Bandaram Pharma Packtech Ltd
Micro Cap
Healthcare Services
Bandaram Pharma Packtech Limited (Formerly known Shiva Medicare Limited) was incorporated on 2 Dec.'91 to manufacture latex gloves. Thereafter, the Company decided to venture into paper industry and was running the business since 2022. But due to increased activity in this line of work, the computer sales and AMC business slowly discontinued and the Company today has only one line of activity, viz, processing and supply of recycled paper.
Company Coordinates stock-summary
Company Details
601 5th Floor Oxford Towers, Old Airport Road Kodihalli Bangalore Karnataka : 560008
stock-summary
Tel:
stock-summary
contact@shivamedicare.com
Registrar Details
Cameo Corporate Services Ltd , Subramanian Buildings No 1 , Club House Road, Chennai