
Compare Bannari Amm.Sug. with Similar Stocks
Dashboard
Company's ability to service its debt is strong with a healthy EBIT to Interest (avg) ratio of 12.23
Poor long term growth as Net Sales has grown by an annual rate of 5.00% and Operating profit at 2.14% over the last 5 years
With a growth in Net Profit of 13.33%, the company declared Very Positive results in Dec 25
With ROE of 7.8, it has a Expensive valuation with a 2.5 Price to Book Value
Despite the size of the company, domestic mutual funds hold only 0% of the company
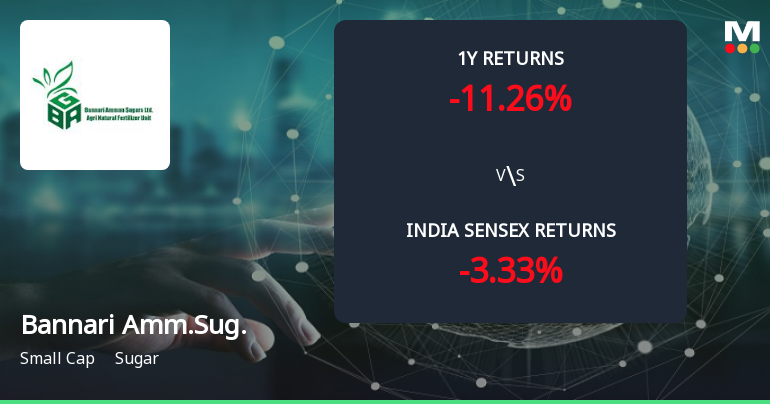
Total Returns (Price + Dividend) 
Latest dividend: 12.5 per share ex-dividend date: Aug-22-2025
Risk Adjusted Returns v/s
Returns Beta

News
Bannari Amman Sugars Ltd Forms Golden Cross Amid Mixed Technical Signals
The 50-day moving average for Bannari Amman Sugars Ltd has crossed above the 200-day moving average, creating a golden cross on 6 May 2026. Yet, the stock declined 0.40% on the day of the crossover, while monthly momentum indicators remain bearish. This juxtaposition of signals calls for a detailed examination of the technical and fundamental context to assess the reliability of this widely watched technical event.
Read full news article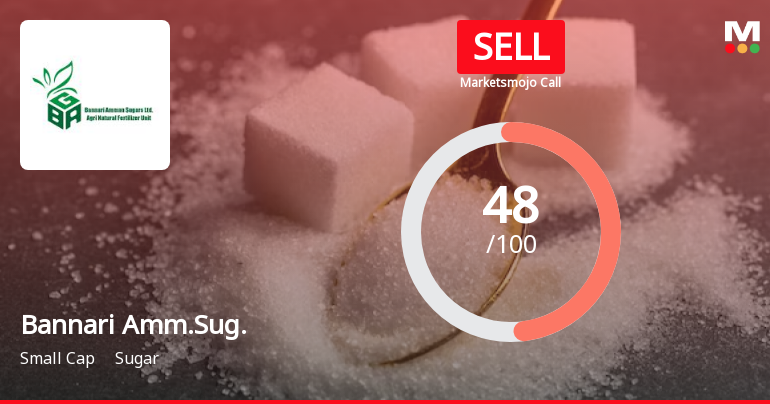
Bannari Amman Sugars Ltd is Rated Sell
Bannari Amman Sugars Ltd is rated 'Sell' by MarketsMOJO, with this rating last updated on 20 Apr 2026. However, the analysis and financial metrics discussed here reflect the stock's current position as of 02 May 2026, providing investors with an up-to-date view of the company’s fundamentals, returns, and market standing.
Read full news article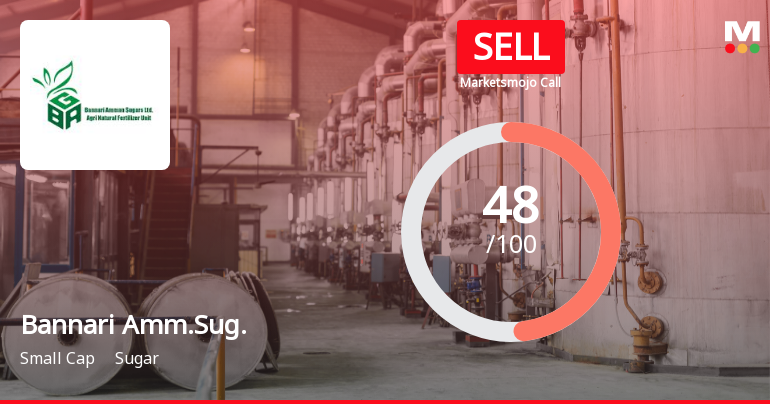
Bannari Amman Sugars Ltd Downgraded to Sell Amid Mixed Financial and Technical Signals
Bannari Amman Sugars Ltd has seen its investment rating downgraded from Hold to Sell, reflecting a combination of deteriorating technical indicators, expensive valuation metrics, and subdued long-term financial growth despite recent positive quarterly results. The company’s overall Mojo Score has declined to 48.0, signalling caution for investors amid mixed signals from quality, valuation, financial trends, and technical analysis.
Read full news article Announcements
Bannari Amman Sugars Limited - Other General Purpose
21-Nov-2019 | Source : NSEBannari Amman Sugars Limited has informed the Exchange regarding Submission of disclosure on Related Party Transactions pursuant to Regulation 23(9) of SEBI (Listing Obligations and Disclosure Requirements) Regulations, 2015 for half year ended September 30, 2019.
Bannari Amman Sugars Limited - Updates
22-Oct-2019 | Source : NSEBannari Amman Sugars Limited has informed the Exchange regarding 'Notice of Board Meeting - Newspaper Publication'.
Bannari Amman Sugars Limited - Trading Window
26-Sep-2019 | Source : NSEBannari Amman Sugars Limited has informed the Exchange regarding the Trading Window closure pursuant to SEBI (Prohibition of Insider Trading) Regulations, 2015
Corporate Actions

No Upcoming Board Meetings

Bannari Amman Sugars Ltd has declared 125% dividend, ex-date: 22 Aug 25

No Splits history available

No Bonus history available

No Rights history available
Quality key factors
Valuation key factors
Technicals key factors
 Technical Indicator Scale: Bearish, Mildly Bearish, Sideways, Mildly Bullish, Bullish Turned
 Shareholding Snapshot : Mar 2026
Shareholding Compare (%holding)
Promoters
None
Held by 0 Schemes
Held by 20 FIIs (0.27%)
Svb Holdings Private Limited (44.0%)
Gagandeep Credit Capital Pvt Ltd (5.53%)
21.92%
Quarterly Results Snapshot (Standalone) - Dec'25 - QoQ

QoQ Growth in quarter ended Dec 2025 is 12.68% vs 36.56% in Sep 2025
QoQ Growth in quarter ended Dec 2025 is 13.33% vs 180.00% in Sep 2025
Half Yearly Results Snapshot (Standalone) - Sep'25

Growth in half year ended Sep 2025 is 12.83% vs -14.87% in Sep 2024
Growth in half year ended Sep 2025 is 42.38% vs -34.78% in Sep 2024
Nine Monthly Results Snapshot (Standalone) - Dec'25
YoY Growth in nine months ended Dec 2025 is 25.81% vs -27.79% in Dec 2024
YoY Growth in nine months ended Dec 2025 is 52.99% vs -46.72% in Dec 2024
Annual Results Snapshot (Standalone) - Mar'25
YoY Growth in year ended Mar 2025 is -19.25% vs -12.09% in Mar 2024
YoY Growth in year ended Mar 2025 is -31.27% vs 6.21% in Mar 2024
About Bannari Amman Sugars Ltd

Company Coordinates


