
Compare Bannari Amm.Sug. with Similar Stocks
Dashboard
Weak Long Term Fundamental Strength with a -1.16% CAGR growth in Operating Profits over the last 5 years
- The company has been able to generate a Return on Equity (avg) of 7.50% signifying low profitability per unit of shareholders funds
Flat results in Mar 26
With ROE of 7.7, it has a Expensive valuation with a 2.3 Price to Book Value
Despite the size of the company, domestic mutual funds hold only 0% of the company
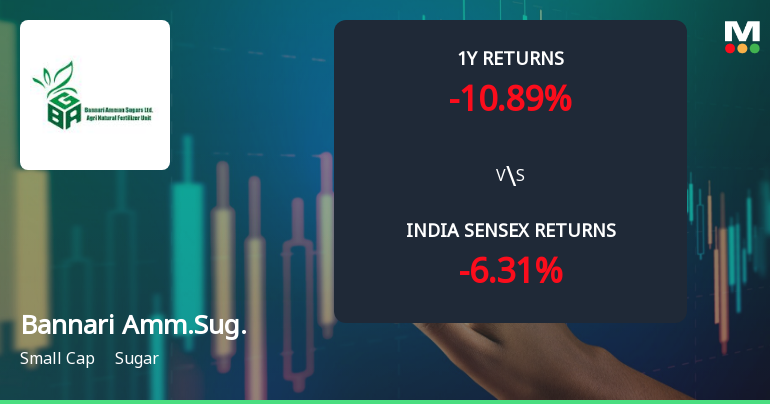
Below par performance in long term as well as near term
Total Returns (Price + Dividend) 
Latest dividend: 12.5 per share ex-dividend date: Aug-22-2025
Risk Adjusted Returns v/s
Returns Beta

News
Bannari Amman Sugars Ltd Technical Momentum Shifts Amid Mixed Market Signals
Bannari Amman Sugars Ltd has experienced a subtle shift in its technical momentum, moving from a mildly bearish to a mildly bullish trend on the daily moving averages, despite lingering bearish signals on weekly and monthly charts. This nuanced change comes amid a backdrop of mixed technical indicators, with the company’s stock price hovering near ₹3,475, reflecting cautious investor sentiment in the sugar sector.
Read full news article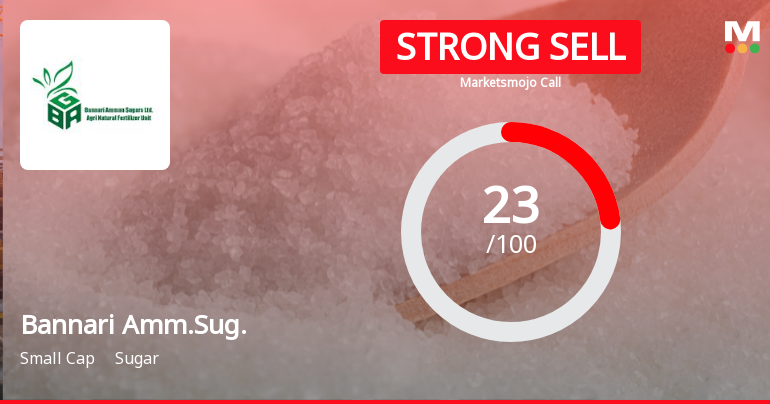
Bannari Amman Sugars Ltd Downgraded to Strong Sell Amid Weak Fundamentals and Bearish Technicals
Bannari Amman Sugars Ltd has seen its investment rating downgraded from Sell to Strong Sell as of 6 July 2026, reflecting deteriorating technical indicators, flat financial trends, expensive valuation metrics, and weak overall quality scores. The small-cap sugar company’s shares have declined 2.23% on the day to ₹3,461.05, underscoring investor caution amid a challenging sector environment and underwhelming performance relative to benchmarks.
Read full news article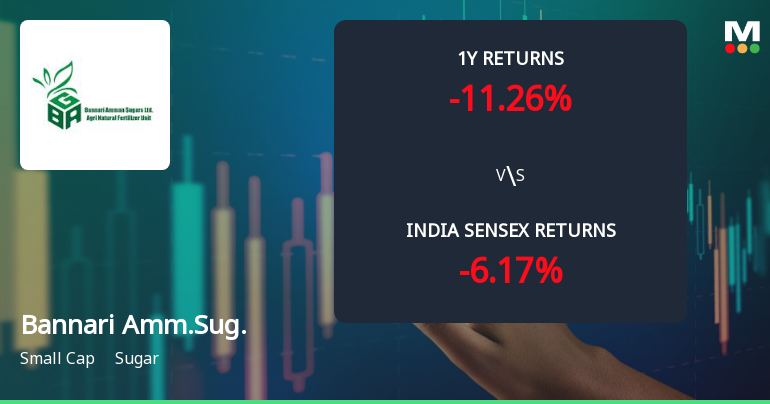
Bannari Amman Sugars Ltd Faces Technical Downshift Amid Bearish Momentum
Bannari Amman Sugars Ltd has experienced a notable shift in its technical momentum, moving from a sideways trend to a mildly bearish stance. Recent technical indicators, including MACD, Bollinger Bands, and moving averages, signal a cautious outlook for this small-cap sugar sector stock, which has also seen a downgrade in its Mojo Grade to Strong Sell as of 6 July 2026.
Read full news article Announcements
Bannari Amman Sugars Limited - Other General Purpose
21-Nov-2019 | Source : NSEBannari Amman Sugars Limited has informed the Exchange regarding Submission of disclosure on Related Party Transactions pursuant to Regulation 23(9) of SEBI (Listing Obligations and Disclosure Requirements) Regulations, 2015 for half year ended September 30, 2019.
Bannari Amman Sugars Limited - Updates
22-Oct-2019 | Source : NSEBannari Amman Sugars Limited has informed the Exchange regarding 'Notice of Board Meeting - Newspaper Publication'.
Bannari Amman Sugars Limited - Trading Window
26-Sep-2019 | Source : NSEBannari Amman Sugars Limited has informed the Exchange regarding the Trading Window closure pursuant to SEBI (Prohibition of Insider Trading) Regulations, 2015
Corporate Actions

No Upcoming Board Meetings

Bannari Amman Sugars Ltd has declared 125% dividend, ex-date: 22 Aug 25

No Splits history available

No Bonus history available

No Rights history available
Quality key factors
Valuation key factors
Technicals key factors
 Technical Indicator Scale: Bearish, Mildly Bearish, Sideways, Mildly Bullish, Bullish Turned
 Shareholding Snapshot : Sep 2025
Shareholding Compare (%holding)
Promoters
None
Held by 1 Schemes (0.0%)
Held by 24 FIIs (0.28%)
Svb Holdings Private Limited (44.0%)
Gagandeep Credit Capital Pvt Ltd (5.53%)
22.05%
Quarterly Results Snapshot (Standalone) - Mar'26 - QoQ

QoQ Growth in quarter ended Mar 2026 is -56.17% vs 12.68% in Dec 2025
QoQ Growth in quarter ended Mar 2026 is -14.07% vs 13.33% in Dec 2025
Half Yearly Results Snapshot (Standalone) - Sep'25

Growth in half year ended Sep 2025 is 12.83% vs -14.87% in Sep 2024
Growth in half year ended Sep 2025 is 42.38% vs -34.78% in Sep 2024
Nine Monthly Results Snapshot (Standalone) - Dec'25
YoY Growth in nine months ended Dec 2025 is 25.81% vs -27.79% in Dec 2024
YoY Growth in nine months ended Dec 2025 is 52.99% vs -46.72% in Dec 2024
Annual Results Snapshot (Standalone) - Mar'26
YoY Growth in year ended Mar 2026 is 6.90% vs -19.25% in Mar 2025
YoY Growth in year ended Mar 2026 is 41.32% vs -31.27% in Mar 2025
About Bannari Amman Sugars Ltd

Company Coordinates


