
Compare Barak Valley with Similar Stocks
Dashboard
Weak Long Term Fundamental Strength with a -16.47% CAGR growth in Operating Profits over the last 5 years
- Company's ability to service its debt is weak with a poor EBIT to Interest (avg) ratio of 1.80
- The company has been able to generate a Return on Equity (avg) of 3.88% signifying low profitability per unit of shareholders funds
Reducing Promoter Confidence
Stock DNA
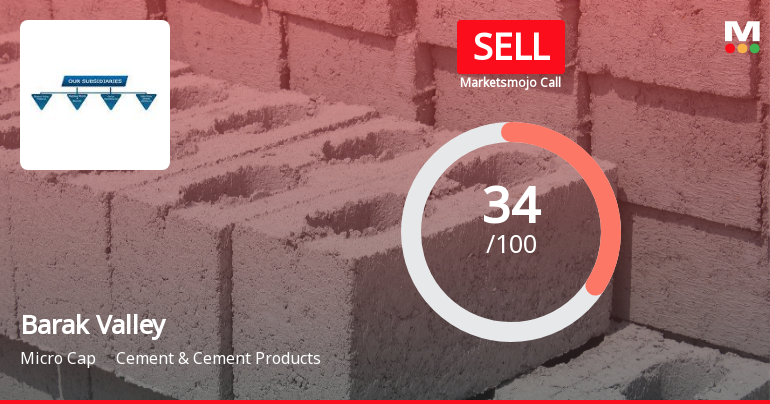
Cement & Cement Products
INR 94 Cr (Micro Cap)
324.00
33
0.00%
0.23
0.23%
0.75
Total Returns (Price + Dividend) 
Latest dividend: 1 per share ex-dividend date: Jul-29-2010
Risk Adjusted Returns v/s
Returns Beta

News
Barak Valley Cements Downgraded to Sell Amid Weak Fundamentals and Bearish Technicals
Barak Valley Cements Ltd has seen its investment rating downgraded from Hold to Sell as of 8 July 2026, reflecting a shift in technical indicators and persistent concerns over its long-term financial fundamentals. Despite a recent quarterly profit rebound, the company’s weak operating profit growth, deteriorating promoter confidence, and bearish technical signals have weighed heavily on investor sentiment, resulting in a 6.36% decline in the stock price on 9 July 2026.
Read full news article
Barak Valley Cements Ltd Upgraded to Hold as Technicals Improve Amid Mixed Financial Signals
Barak Valley Cements Ltd has seen its investment rating upgraded from Sell to Hold, reflecting a notable shift in technical indicators and a return to positive financial performance after a challenging period. The upgrade, announced on 3 July 2026, is underpinned by improvements across four key parameters: quality, valuation, financial trend, and technicals, signalling cautious optimism for investors in this micro-cap cement sector player.
Read full news article
Barak Valley Cements Upgraded to Sell on Technical Improvement Despite Weak Fundamentals
Barak Valley Cements Ltd has seen its investment rating upgraded from Strong Sell to Sell as of 23 June 2026, driven primarily by a shift in technical indicators despite ongoing fundamental challenges. The micro-cap cement company’s recent quarterly performance and market behaviour have prompted a reassessment of its outlook, reflecting a nuanced balance between improving market signals and persistent financial weaknesses.
Read full news article Announcements
Compliances-Certificate under Reg. 74 (5) of SEBI (DP) Regulations 2018
03-Jul-2026 | Source : BSECompliance Certificate received from RTA enclosed
Closure of Trading Window
25-Jun-2026 | Source : BSEIntimation regarding closure of trading window enclosed.
Intimation Pursuant To Regulation 30 Of The SEBI (Listing Obligations And Disclosure Requirements) Regulations 2015 -Signing Of Memorandum Of Understanding (Mou) With M/S LKC Industries And Infra Private Limited
30-May-2026 | Source : BSEas enclosed
Corporate Actions

No Upcoming Board Meetings

Barak Valley Cements Ltd has declared 10% dividend, ex-date: 29 Jul 10

No Splits history available

No Bonus history available

No Rights history available
Quality key factors
Valuation key factors
Technicals key factors
 Technical Indicator Scale: Bearish, Mildly Bearish, Sideways, Mildly Bullish, Bullish Turned
 Shareholding Snapshot : Jun 2026
Shareholding Compare (%holding)
Promoters
None
Held by 0 Schemes
Held by 0 FIIs
Bina Garodia (9.75%)
Padmawati Credit Capital Pvt Ltd (2.7%)
37.5%
Quarterly Results Snapshot (Consolidated) - Mar'26 - QoQ

QoQ Growth in quarter ended Mar 2026 is 25.18% vs 0.63% in Dec 2025
QoQ Growth in quarter ended Mar 2026 is 162.77% vs -1,183.33% in Dec 2025
Half Yearly Results Snapshot (Consolidated) - Sep'25
Growth in half year ended Sep 2025 is 10.10% vs -10.42% in Sep 2024
Growth in half year ended Sep 2025 is -56.27% vs -56.31% in Sep 2024
Nine Monthly Results Snapshot (Consolidated) - Dec'25
YoY Growth in nine months ended Dec 2025 is 1.70% vs -9.34% in Dec 2024

YoY Growth in nine months ended Dec 2025 is -129.07% vs -52.61% in Dec 2024
Annual Results Snapshot (Consolidated) - Mar'26
YoY Growth in year ended Mar 2026 is 2.04% vs -11.14% in Mar 2025
YoY Growth in year ended Mar 2026 is -94.39% vs -28.69% in Mar 2025
About Barak Valley Cements Ltd

Company Coordinates


