
Compare Basant Agro Tech with Similar Stocks
Dashboard
Weak Long Term Fundamental Strength with an average Return on Capital Employed (ROCE) of 8.79%
- Poor long term growth as Net Sales has grown by an annual rate of 11.95% and Operating profit at 11.86% over the last 5 years
- Low ability to service debt as the company has a high Debt to EBITDA ratio of 4.50 times
Consistent Underperformance against the benchmark over the last 3 years
Total Returns (Price + Dividend) 
Latest dividend: 0.05 per share ex-dividend date: Sep-12-2025
Risk Adjusted Returns v/s
Returns Beta

News

Basant Agro Tech (India) Ltd is Rated Sell
Basant Agro Tech (India) Ltd is rated 'Sell' by MarketsMOJO, with this rating last updated on 09 February 2026. However, the analysis and financial metrics discussed here reflect the company’s current position as of 01 June 2026, providing investors with an up-to-date perspective on the stock’s fundamentals, valuation, financial trends, and technical outlook.
Read full news articleAre Basant Agro Tech (India) Ltd latest results good or bad?
Basant Agro Tech (India) Ltd's latest financial results for Q4 FY26 present a mixed operational picture. The company reported a net profit of ₹2.21 crore, reflecting a significant year-on-year growth of 92.17%, contrasting sharply with a substantial decline in the same quarter last year. Revenue for the quarter reached ₹162.86 crore, marking a year-on-year increase of 22.89%, although this growth rate is lower than the previous year's 33.45%. Despite the positive revenue and profit figures, the company's operating margin has come under pressure, declining to 5.48% from 6.24% in the prior year. This trend indicates potential challenges related to rising input costs or competitive pricing pressures within the fertiliser sector. The company's ability to maintain profitability amidst these margin pressures is a critical concern. The quarterly results also highlight a notable sequential profit growth of 76.80%...
Read full news article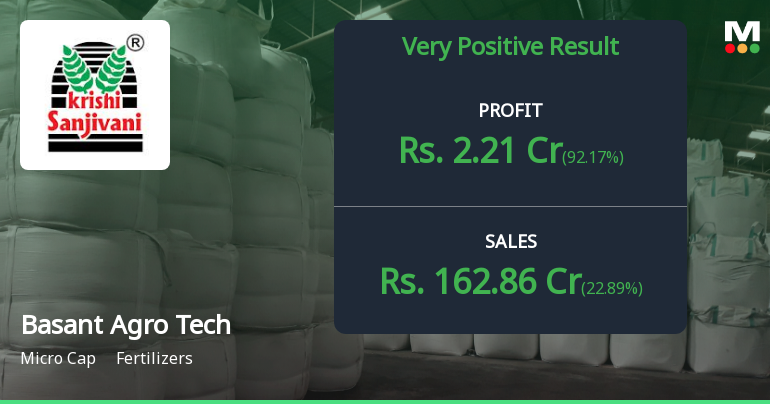
Basant Agro Tech Q4 FY26: Strong Profit Surge Masks Margin Erosion Concerns
Basant Agro Tech (India) Ltd., a micro-cap fertiliser manufacturer with a market capitalisation of ₹120.00 crores, reported a robust 92.17% year-on-year surge in net profit for Q4 FY26, reaching ₹2.21 crores compared to ₹1.15 crores in the corresponding quarter last year. The strong bottom-line growth was driven by a 22.89% increase in net sales to ₹162.86 crores, though operating margins continued their downward trajectory, raising questions about the sustainability of profitability expansion.
Read full news article Announcements
Compliances-Reg.24(A)-Annual Secretarial Compliance
30-May-2026 | Source : BSEAnnual Secretarial Compliance Report for the year ended March 31 2026.
Board Meeting Outcome for Outcome Of The Board Meeting Held On 29.05..2026
29-May-2026 | Source : BSEOutcome of the Board Meeting held on 29.05.2026.
Board Meeting Outcome for Outcome Of The Board Meeting Held On 29.05..2026
29-May-2026 | Source : BSEOutcome of the Board Meeting held on 29.05.2026.
Corporate Actions

No Upcoming Board Meetings

Basant Agro Tech (India) Ltd has declared 5% dividend, ex-date: 12 Sep 25

Basant Agro Tech (India) Ltd has announced 1:10 stock split, ex-date: 26 Feb 10

No Bonus history available

Basant Agro Tech (India) Ltd has announced 3:2 rights issue, ex-date: 04 Jul 06
Quality key factors
Valuation key factors
Technicals key factors
 Technical Indicator Scale: Bearish, Mildly Bearish, Sideways, Mildly Bullish, Bullish Turned
 Shareholding Snapshot : Mar 2026
Shareholding Compare (%holding)
Promoters
None
Held by 1 Schemes (0.02%)
Held by 0 FIIs
Shashikant C Bhartia (9.18%)
Muktilal Ganulal Paldiwal (2.58%)
40.95%
Quarterly Results Snapshot (Standalone) - Mar'26 - YoY

YoY Growth in quarter ended Mar 2026 is 22.89% vs 33.45% in Mar 2025

YoY Growth in quarter ended Mar 2026 is 92.17% vs -82.94% in Mar 2025
Half Yearly Results Snapshot (Standalone) - Sep'25
Growth in half year ended Sep 2025 is 13.26% vs 7.19% in Sep 2024
Growth in half year ended Sep 2025 is 33.46% vs 254.71% in Sep 2024
Nine Monthly Results Snapshot (Standalone) - Dec'25
YoY Growth in nine months ended Dec 2025 is 22.68% vs 8.11% in Dec 2024
YoY Growth in nine months ended Dec 2025 is 58.14% vs 208.27% in Dec 2024
Annual Results Snapshot (Standalone) - Mar'26
YoY Growth in year ended Mar 2026 is 22.74% vs 14.33% in Mar 2025
YoY Growth in year ended Mar 2026 is 68.11% vs 5.30% in Mar 2025
About Basant Agro Tech (India) Ltd

Company Coordinates


