
Compare BASF India with Similar Stocks
Stock DNA
Specialty Chemicals
INR 15,240 Cr (Small Cap)
35.00
29
0.60%
-0.19
10.36%
3.67
Total Returns (Price + Dividend) 
Latest dividend: 20 per share ex-dividend date: Jul-30-2025
Risk Adjusted Returns v/s
Returns Beta

News

BASF India Ltd is Rated Sell by MarketsMOJO
BASF India Ltd is rated 'Sell' by MarketsMOJO, with this rating last updated on 20 May 2026. However, the analysis and financial metrics discussed here reflect the stock's current position as of 12 June 2026, providing investors with an up-to-date perspective on the company’s fundamentals, valuation, financial trends, and technical outlook.
Read full news article
BASF India Ltd is Rated Sell by MarketsMOJO
BASF India Ltd is rated 'Sell' by MarketsMOJO, with this rating last updated on 20 May 2026. However, the analysis and financial metrics discussed here reflect the stock's current position as of 01 June 2026, providing investors with the latest insights into the company’s performance and outlook.
Read full news article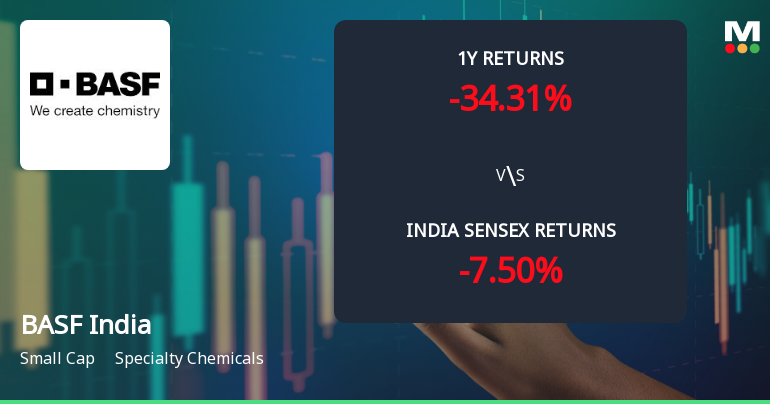
BASF India Ltd Technical Momentum Shifts Amid Bearish Sentiment
BASF India Ltd has experienced a notable shift in its technical momentum, with key indicators signalling a transition from mildly bearish to bearish trends. Despite a modest day decline of 0.54%, the stock’s technical parameters reveal a complex interplay of bullish and bearish signals across weekly and monthly timeframes, raising questions about its near-term trajectory within the Specialty Chemicals sector.
Read full news article Announcements
Announcement under Regulation 30 (LODR)-Analyst / Investor Meet - Outcome
27-May-2026 | Source : BSETranscript of the Analyst / Fund Managers meeting of BASF India Limited held on 22nd May 2026 at 4 pm through Audio Visual means.
Announcement under Regulation 30 (LODR)-Analyst / Investor Meet - Outcome
23-May-2026 | Source : BSERecording of the Analyst/Fund managers meet of BASF India Limited held on 22nd May 2026
Announcement under Regulation 30 (LODR)-Newspaper Publication
23-May-2026 | Source : BSENewspaper Publication regarding the Notice of the NCLT convened meeting of Equity Shareholders of BASF India Limited to be held on 24th June 2026 at 3.30 PM IST through Audio Visual Means.
Corporate Actions

No Upcoming Board Meetings

BASF India Ltd has declared 250% dividend, ex-date: 30 Jul 26

No Splits history available

No Bonus history available

No Rights history available
Quality key factors
Valuation key factors
Technicals key factors
 Technical Indicator Scale: Bearish, Mildly Bearish, Sideways, Mildly Bullish, Bullish Turned
 Shareholding Snapshot : Mar 2026
Shareholding Compare (%holding)
Promoters
None
Held by 10 Schemes (2.86%)
Held by 118 FIIs (5.34%)
Basf Societas Europaea (52.75%)
Tata Mutual Fund - Tata Small Cap Fund (2.37%)
11.23%
Quarterly Results Snapshot (Consolidated) - Mar'26 - YoY

YoY Growth in quarter ended Mar 2026 is 4.78% vs -2.18% in Mar 2025
YoY Growth in quarter ended Mar 2026 is 155.02% vs -83.27% in Mar 2025
Half Yearly Results Snapshot (Consolidated) - Sep'25
Not Applicable: The company has declared_date for only one period
Not Applicable: The company has declared_date for only one period
Nine Monthly Results Snapshot (Consolidated) - Dec'25

YoY Growth in nine months ended Dec 2025 is -0.56% vs 75.48% in Dec 2024
YoY Growth in nine months ended Dec 2025 is -22.31% vs -9.01% in Dec 2024
Annual Results Snapshot (Consolidated) - Mar'26
YoY Growth in year ended Mar 2026 is 1.11% vs 7.36% in Mar 2025
YoY Growth in year ended Mar 2026 is -12.31% vs -14.95% in Mar 2025
About BASF India Ltd

Company Coordinates


