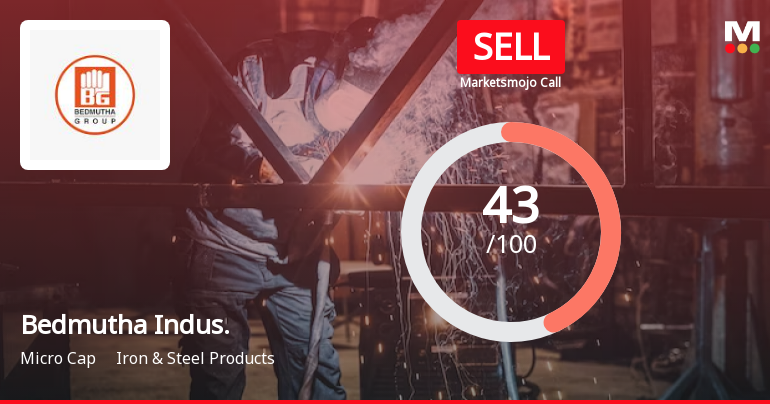
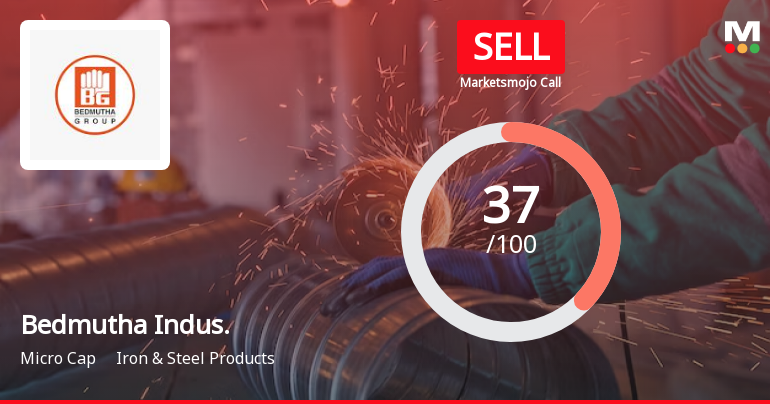
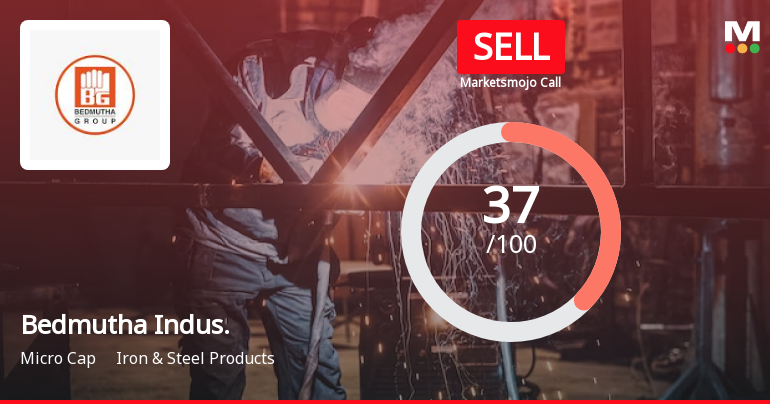
Bedmutha Indus.

  • Market Cap: Micro Cap
  • Industry: Iron & Steel Products
  • ISIN: INE844K01012
  • NSEID: BEDMUTHA
  • BSEID: 533270
INR
107.80
1.6 (1.51%)
BSENSE

Sep 11, 11:06 AM

BSE+NSE Vol: 5.48 k

  • Price Points
  • Score
  • Mojo Parameters
  • Total Return
  • News and Corporate Actions
  • Key factors
  • Shareholding
  • Financials
  • CompanyCV
stock-summaryPrice Point
High/Low

1Day

52 Week

Valuation
Technical
Day's Volume

CASH

5.48 k (344.38%) Volume

Shareholding (Jun 2026)

FII

0.00%

Held by 0 FIIs

DII

0.00%

Held by 0 DIIs

Promoter

57.09%

Which are the latest news on Bedmutha Indus.?

11-Sep-2026

Why is Bedmutha Industries Ltd falling/rising?

06-Sep-2026

As of 05-Sep, Bedmutha Industries Ltd's stock price is rising, currently at Rs 112.50, with a 1.86% increase. The stock has shown strong performance, gaining 6.84% over the past week, driven by increased investor interest and positive trading momentum.

As of 05-Sep, Bedmutha Industries Ltd's stock price is rising, currently at Rs 112.50, reflecting a change of 2.05 (1.86%) upwards. The stock has shown a strong performance over the past week, with a return of +6.84%, significantly outperforming the Sensex, which declined by -0.97% during the same period. Additionally, the stock has been on a positive trend, gaining for the last three consecutive days and achieving a total return of 5.14% in that timeframe.<BR><BR>Today's trading activity indicates a robust interest from investors, as evidenced by a delivery volume of 9.14k on September 3, which has increased by 214.52% compared to the 5-day average delivery volume. This rising investor participation suggests a growing confidence in the stock. Furthermore, the stock reached an intraday high of Rs 113.25, indicating positive momentum.<BR><BR>Overall, the combination of strong recent performance, increased investor participation, and positive price movements contributes to the rising trend of Bedmutha Industries Ltd's stock price.

View full answer

Who are in the management team of Bedmutha Indus.?

01-Sep-2026

The management team of Bedmutha Indus includes Vijay Kachardas Vedmutha (Chairman & Managing Director), Ajay Kachardas Vedmutha (Managing Director & CFO), and several independent directors, including Narayan Kadu, Vandana Sonwaney, Vasant B Joshi, and Shreekrishna Marathe, along with Company Secretary Ajay Subhash Topale and Executive Chairman Kachardas Ratanchand Bedmutha. They are responsible for the company's strategic direction and operations.

The management team of Bedmutha Indus includes the following key individuals:<BR><BR>1. **Vijay Kachardas Vedmutha** - Chairman & Managing Director<BR>2. **Ajay Kachardas Vedmutha** - Managing Director & CFO<BR>3. **Narayan Kadu** - Independent Director<BR>4. **Vandana Sonwaney** - Independent Director<BR>5. **Vasant B Joshi** - Independent Director<BR>6. **Ajay Subhash Topale** - Company Secretary<BR>7. **Shreekrishna Marathe** - Independent Director<BR>8. **Kachardas Ratanchand Bedmutha** - Executive Chairman<BR><BR>This team plays a crucial role in guiding the company's strategic direction and operations.

View full answer

What does Bedmutha Indus. do?

01-Sep-2026

Bedmutha Industries Ltd is a micro-cap manufacturer of steel wire, originally incorporated in 1990 and publicly listed since 1997. As of June 2026, it reported net sales of ₹541 Cr and a net profit of ₹7 Cr.

Overview: <BR>Bedmutha Industries Ltd is a leading manufacturer of steel wire, operating within the Iron & Steel Products industry and classified as a micro-cap company.<BR><BR>History: <BR>Bedmutha Industries Ltd was originally incorporated on August 23, 1990, as Bedmutha Wire Company Pvt Ltd. It transitioned to a public limited company on September 23, 1997, changing its name to Bedmutha Wire Company Limited, and later to Bedmutha Industries Limited on November 18, 2009. The most recent quarterly results reported net sales and net profit for June 2026.<BR><BR>Financial Snapshot: <BR>Net Sales: 541 Cr (Quarterly Results - Jun 2026) <BR>Net Profit: 7 Cr (Quarterly Results - Jun 2026) <BR>Market Cap: INR 342 Cr (Micro Cap) <BR><BR>Key Metrics: <BR>P/E: 21.00 <BR>Industry P/E: 25 <BR>Dividend Yield: 0.00% <BR>Debt-Equity: 1.23 <BR>Return on Equity: 4.28% <BR>Price to Book: 2.24 <BR><BR>Contact Details: <BR>Address: A 70/71/72 STICE Musalgaon, Sinnar Nashik Maharashtra : 422103 <BR>Tel: 91-2551-240481/631/068/069 <BR>Email: cs@bedmutha.com <BR>Website: http://www.bedmutha.com

View full answer

Who are the peers of the Bedmutha Indus.?

01-Sep-2026

Peers of Bedmutha Indus. include Aerpace Indus, Azad India, Suraj, Manaksia, Shah Metacorp, Suraj Products, Remi Edelstahl, Supershakti Met., and P S Raj Steels. Bedmutha Indus. has a 1-year return of -19.29%, worse than its peers, with Remi Edelstahl leading at 55.12% and Azad India at -32.30%.

Peers: The peers of Bedmutha Indus. are Aerpace Indus, Azad India, Suraj, Manaksia, Shah Metacorp, Suraj Products, Remi Edelstahl, Supershakti Met., and P S Raj Steels.<BR><BR>Quality Snapshot: Below Average management risk is observed at Aerpace Indus, Shah Metacorp, Remi Edelstahl, and the rest. Average management risk is found at Suraj, Manaksia, Supershakti Met., and P S Raj Steels. Good growth is noted at Azad India and Chaman Metallics, while Average growth is seen at Suraj, Manaksia, and the rest. Excellent capital structure is present at Azad India, Suraj Products, and P S Raj Steels, while Below Average capital structure is noted at Aerpace Indus, Bedmutha Indus., and the rest.<BR><BR>Return Snapshot: The peer with the highest 1-year return is Remi Edelstahl at 55.12%, while Azad India has the lowest at -32.30%. Bedmutha Indus.'s 1-year return of -19.29% is worse than both. Additionally, Suraj, Manaksia, Shah Metacorp, and Bedmutha Indus. all have negative six-month returns.

View full answer

How big is Bedmutha Indus.?

01-Sep-2026

As of 31st August, Bedmutha Industries Ltd has a market capitalization of 342.00 Cr, with recent net sales of 1697.57 Cr and a net profit of 16.72 Cr.

As of 31st August, Bedmutha Industries Ltd has a market capitalization of 342.00 Cr, categorizing it as a Micro Cap company.<BR><BR>In the latest four quarters, Bedmutha Industries Ltd reported Net Sales of 1697.57 Cr and a Net Profit of 16.72 Cr.<BR><BR>The latest annual period for the balance sheet is March 2025, with Shareholder's Funds amounting to 145.28 Cr and Total Assets of 654.59 Cr.

View full answer

Should I buy, sell or hold Bedmutha Industries Ltd?

14-Aug-2026

Are Bedmutha Industries Ltd latest results good or bad?

29-May-2026

Bedmutha Industries Ltd's latest Q4 FY26 results show strong revenue growth and a significant increase in net profit, but concerns about inconsistent profitability, high promoter pledging at 95.06%, and a high debt burden suggest caution for investors. The overall outlook is mixed, highlighting both positive developments and significant risks.

Bedmutha Industries Ltd's latest results for Q4 FY26 show a mix of positive and concerning elements. On the positive side, the company reported a net profit of ₹14.63 crores, which is a remarkable increase of 475.13% quarter-on-quarter and 606.76% year-on-year. Additionally, revenue reached an all-time high of ₹435.63 crores, reflecting a 22.08% increase from the previous quarter and a significant 54.63% growth year-on-year. The operating margin also improved to 5.34%, the highest in seven quarters.<BR><BR>However, there are significant concerns that overshadow these improvements. The company's profitability has been inconsistent, with losses in three of the previous four quarters before this positive quarter. Furthermore, a critical issue is the heavy reliance on other income, which constituted 92.80% of profit before tax in Q4 FY26, raising questions about the sustainability of these earnings. <BR><BR>Additionally, the promoter pledging stands at an alarming 95.06%, indicating severe financial stress among the promoters and posing a substantial risk to minority shareholders. The company's high debt burden, reflected in a debt-to-EBITDA ratio of 5.42 times, further complicates its financial health.<BR><BR>In summary, while the latest results show strong revenue growth and improved margins, the underlying issues related to profitability consistency, high promoter pledging, and debt levels suggest caution for investors. The overall outlook remains mixed, with significant risks that could impact future performance.

View full answer

When is the next results date for Bedmutha Industries Ltd?

22-May-2026

The next results date for Bedmutha Industries Ltd is 28 May 2026.

The next results date for Bedmutha Industries Ltd is scheduled for 28 May 2026.

View full answer

How has been the historical performance of Bedmutha Indus.?

13-Nov-2025

Bedmutha Indus. has demonstrated significant growth from March 2020 to March 2025, with net sales increasing from 360.80 Cr to 1,049.33 Cr, and profitability improving from losses to a profit after tax of 24.80 Cr. The company has also strengthened its balance sheet, with total assets rising and liabilities decreasing during this period.

Answer:<BR>The historical performance of Bedmutha Indus. shows a significant upward trend in net sales and profitability over the past few years, culminating in the fiscal year ending March 2025.<BR><BR>Breakdown:<BR>Bedmutha Indus. has experienced a steady increase in net sales, rising from 360.80 Cr in March 2020 to 1,049.33 Cr in March 2025. This growth is reflected in total operating income, which also grew from 360.80 Cr to 1,049.33 Cr during the same period. The company has managed to improve its operating profit, with an operating profit (PBDIT) of 80.19 Cr in March 2025, up from a loss of 0.81 Cr in March 2020. Profit before tax has similarly improved, reaching 24.80 Cr in March 2025 compared to a loss of 71.02 Cr in March 2020. The profit after tax has followed suit, increasing from a loss of 71.10 Cr in March 2020 to 24.80 Cr in March 2025. The company's total assets have grown from 478.54 Cr in March 2020 to 654.59 Cr in March 2025, while total liabilities have decreased from 460.66 Cr to 217.31 Cr over the same period. Cash flow from operating activities has also improved, increasing to 108.00 Cr in March 2025 from 77.00 Cr in March 2020, indicating a stronger cash position. Overall, Bedmutha Indus. has shown a remarkable recovery and growth trajectory in its financial performance over the years.

View full answer

Is Bedmutha Indus. overvalued or undervalued?

30-Sep-2025

As of September 29, 2025, Bedmutha Industries is fairly valued with a PE ratio of 38.73 and an EV to EBITDA of 19.44, but its stock has underperformed with a year-to-date return of -30.84%, indicating market sentiment may be negatively impacting its price despite being positioned in the middle of its industry valuation spectrum.

As of 29 September 2025, Bedmutha Industries has moved from an attractive to a fair valuation grade. The company appears to be fairly valued based on its current metrics, with a PE ratio of 38.73, an EV to EBITDA of 19.44, and a ROE of 17.08%. When compared to peers, JSW Steel has a higher PE of 53.78 and Tata Steel, which is rated attractive, has a PE of 43.48, indicating that Bedmutha is positioned in the middle of the valuation spectrum within its industry.<BR><BR>Despite the fair valuation, Bedmutha's recent stock performance has been underwhelming, with a year-to-date return of -30.84% compared to a positive 2.85% return of the Sensex. This suggests that while the company is fairly valued, market sentiment may be affecting its stock price negatively. Overall, the valuation indicates that Bedmutha Industries is neither undervalued nor overvalued at this time.

View full answer

Who are the top shareholders of the Bedmutha Indus.?

17-Jul-2025

The top shareholders of Bedmutha Industries include promoter Ajay Kachardas Vedmutha with 10.78% ownership, K Fx Services Pvt Ltd as the largest public shareholder at 18.31%, and individual investors holding a total of 19.15%. There are no mutual funds invested, and foreign institutional investors have negligible holdings.

The top shareholders of Bedmutha Industries include the promoters, who are the majority shareholders. The promoter with the highest holding is Ajay Kachardas Vedmutha, owning 10.78% of the company. Additionally, the highest public shareholder is K Fx Services Pvt Ltd, which holds 18.31%. Individual investors collectively hold 19.15% of the shares. It's also worth noting that there are no mutual funds currently holding shares in the company, and two foreign institutional investors (FIIs) have a negligible holding of 0.0%.

View full answer

What is the technical trend for Bedmutha Indus.?

09-Jun-2025

As of June 2, 2025, Bedmutha Indus. shows a mildly bearish trend overall, with mixed signals from MACD and moving averages indicating short-term weakness despite a mildly bullish stance on the monthly chart.

As of 2 June 2025, the technical trend for Bedmutha Indus. has changed from bearish to mildly bearish. The weekly MACD indicates a mildly bullish stance, while the monthly MACD is mildly bearish. The Bollinger Bands and KST both show a mildly bearish trend on the weekly and monthly time frames. Daily moving averages remain bearish, suggesting short-term weakness. Dow Theory indicates a mildly bullish trend on the monthly chart, but no trend on the weekly. Overall, the current technical stance is mildly bearish, driven primarily by the mixed signals from MACD and moving averages.

View full answer

Has Bedmutha Indus. declared dividend?

06-Jun-2025

No Dividend History Available

iScoreScore
Click here to find our call on this stock
Strong Sell
Sell
Hold
Buy
Strong Buy

Dashboard

1

Weak Long Term Fundamental Strength with an average Return on Capital Employed (ROCE) of 2.82%

  • Low ability to service debt as the company has a high Debt to EBITDA ratio of 3.51 times
2

94.99% of Promoter Shares are Pledged

3

Underperformed the market in the last 1 year

stock-summaryMojo Parameters

Mojo Parameters

Loading Valuation Snapshot...

Stock DNA

stock-summary
Industry

Iron & Steel Products

stock-summary
Market cap

INR 348 Cr (Micro Cap)

stock-summary
P/E

20.00

stock-summary
Industry P/E

25

stock-summary
Dividend Yield

0.00%

stock-summary
Debt Equity

1.23

stock-summary
Return on Equity

4.28%

stock-summary
Price to Book

2.26

Revenue and Profits:
Net Sales:
541 Cr
(Quarterly Results - Jun 2026)
Net Profit:
7 Cr
stock-summaryTotal Returns
Total Returns (Price + Dividend) stock-summary
Dividend Yield (0%)
TimePeriod
Price Return
Dividend Return
Total Return
3 Months
-0.19%
0%
-0.19%
6 Months
-15.95%
0%
-15.95%
1 Year
-25.19%
0%
-25.19%
2 Years
-47.38%
0%
-47.38%
3 Years
52.58%
0%
52.58%
4 Years
53.02%
0%
53.02%
5 Years
185.19%
0%
185.19%

Bedmutha Indus. for the last several years.

Risk Adjusted Returns v/s stock-summary
Returns Beta
Icon
Beta has not been calculated since enough price history is not available
stock-summaryNews & Corporate Actions

Announcements stock-summary

Disclosures under Reg. 29(1) of SEBI (SAST) Regulations 2011

09-Sep-2026 | Source : BSE

The Exchange has received the disclosure under Regulation 29(1) of SEBI (Substantial Acquisition of Shares & Takeovers) Regulations 2011 for S R Foundation & Others

Announcement under Regulation 30 (LODR)-Newspaper Publication

08-Sep-2026 | Source : BSE

Please find attached newspaper advertisement given for ensuing 36th AGM of the company post dispatch of Annual report

Letter For The Annual Report Web-Link/Web Path Sent To Those Members Who Have Not Registered Their Email Address

07-Sep-2026 | Source : BSE

Please find attached herewith the letter sent to the shareholders whose email is were not available in the record of the company/depository/RTA to access 36th Annual report of the company

Corporate Actions stock-summary

stock-summary
BOARD MEETING

No Upcoming Board Meetings

stock-summary
DIVIDEND

No Dividend history available

stock-summary
SPLITS

No Splits history available

stock-summary
BONUS

No Bonus history available

stock-summary
RIGHTS

No Rights history available

stock-summaryKey Factors

Quality key factors stock-summary

Factor
Value
Sales Growth (5y)
28.56%
EBIT Growth (5y)
23.31%
EBIT to Interest (avg)
0.14
Debt to EBITDA (avg)
7.59
Net Debt to Equity (avg)
1.23
Sales to Capital Employed (avg)
2.47
Tax Ratio
0
Dividend Payout Ratio
0
Pledged Shares
94.99%
Institutional Holding
0
ROCE (avg)
-1.03%
ROE (avg)
12.53%

Valuation key factors

Factor
Value
P/E Ratio
20
Industry P/E
25
Price to Book Value
2.26
EV to EBIT
12.70
EV to EBITDA
7.96
EV to Capital Employed
1.56
EV to Sales
0.31
PEG Ratio
0.45
Dividend Yield
NA
ROCE (Latest)
10.10%
ROE (Latest)
4.28%

Technicals key factors

Indicator
Weekly
Monthly
MACD
Mildly Bullish
Bearish
RSI
No Signal
No Signal
Bollinger Bands
Sideways
Bearish
Moving Averages
Bearish (Daily)
KST
Mildly Bullish
Bearish
Dow Theory
No Trend
No Trend
OBV
Mildly Bullish
No Trend
stock-summary Technical Indicator Scale: Bearish, Mildly Bearish, Sideways, Mildly Bullish, Bullish  Turned 
stock-summaryShareholding
Shareholding Snapshot : Jun 2026stock-summary
Shareholding Compare (%holding) stock-summary
Majority shareholders

Promoters

Pledged Promoter Holdings

94.9921

Mutual Funds

Held by 0 Schemes

FIIs

Held by 0 FIIs

Promoter with highest holding

Ajay Kachardas Vedmutha (10.78%)

Highest Public shareholder

K Fx Services Pvt Ltd (18.31%)

Individual Investors Holdings

19.42%

stock-summaryFinancial
[
  {
    "link": "quarterly",
    "btn_text": "All Quarterly Results",
    "header": "Quarterly Results Snapshot (Consolidated) - Jun'26 - YoY",
    "rhs": [
      {
        "prefix": "Net Sales ",
        "suffix": "YoY Growth in quarter ended Jun 2026 is 74.32% vs 28.04% in Jun 2025",
        "dir": 1
      },
      {
        "prefix": "Consolidated Net Profit ",
        "suffix": "YoY Growth in quarter ended Jun 2026 is 309.70% vs -132.87% in Jun 2025",
        "dir": 1
      }
    ],
    "table": {
      "header": [
        "Jun'26",
        "Jun'25",
        "Change(%)"
      ],
      "body": [
        {
          "field": "Net Sales",
          "val1": "541.43",
          "val2": "310.60",
          "chgp": "74.32%",
          "chgp_class": "positive"
        },
        {
          "field": "Operating Profit (PBDIT) excl Other Income",
          "val1": "17.75",
          "val2": "10.52",
          "chgp": "68.73%",
          "chgp_class": "positive"
        },
        {
          "field": "Interest",
          "val1": "8.61",
          "val2": "8.96",
          "chgp": "-3.91%",
          "chgp_class": "positive"
        },
        {
          "field": "Exceptional Items",
          "val1": "0.00",
          "val2": "0.00",
          "chgp": "",
          "chgp_class": "neutral"
        },
        {
          "field": "Consolidate Net Profit",
          "val1": "6.92",
          "val2": "-3.30",
          "chgp": "309.70%",
          "chgp_class": "positive"
        },
        {
          "field": "Operating Profit Margin (Excl OI)",
          "val1": "3.28%",
          "val2": "3.39%",
          "chgp": "-0.11%",
          "chgp_class": "negative"
        }
      ]
    }
  },
  {
    "link": "half-yearly",
    "btn_text": "All Half Yearly Results",
    "header": "Half Yearly Results Snapshot (Consolidated) - Sep'25",
    "rhs": [
      {
        "prefix": "Net Sales ",
        "suffix": " Growth in half year ended Sep 2025 is 36.48% vs 26.38% in Sep 2024",
        "dir": 1
      },
      {
        "prefix": "Consolidated Net Profit ",
        "suffix": " Growth in half year ended Sep 2025 is -120.49% vs 168.05% in Sep 2024",
        "dir": -1
      }
    ],
    "table": {
      "header": [
        "Sep'25",
        "Sep'24",
        "Change(%)"
      ],
      "body": [
        {
          "field": "Net Sales",
          "val1": "674.27",
          "val2": "494.04",
          "chgp": "36.48%",
          "chgp_class": "positive"
        },
        {
          "field": "Operating Profit (PBDIT) excl Other Income",
          "val1": "24.78",
          "val2": "17.47",
          "chgp": "41.84%",
          "chgp_class": "positive"
        },
        {
          "field": "Interest",
          "val1": "19.23",
          "val2": "17.35",
          "chgp": "10.84%",
          "chgp_class": "negative"
        },
        {
          "field": "Exceptional Items",
          "val1": "0.00",
          "val2": "0.00",
          "chgp": "",
          "chgp_class": "neutral"
        },
        {
          "field": "Consolidate Net Profit",
          "val1": "-4.23",
          "val2": "20.64",
          "chgp": "-120.49%",
          "chgp_class": "negative"
        },
        {
          "field": "Operating Profit Margin (Excl OI)",
          "val1": "3.68%",
          "val2": "3.54%",
          "chgp": "0.14%",
          "chgp_class": "positive"
        }
      ]
    }
  },
  {
    "link": "nine-monthly",
    "btn_text": "All Nine Monthly Results",
    "header": "Nine Monthly Results Snapshot (Consolidated) - Dec'25",
    "rhs": [
      {
        "prefix": "Net Sales ",
        "suffix": "YoY Growth in nine months ended Dec 2025 is 34.33% vs 31.77% in Dec 2024",
        "dir": 1
      },
      {
        "prefix": "Consolidated Net Profit ",
        "suffix": "YoY Growth in nine months ended Dec 2025 is -135.74% vs 60.21% in Dec 2024",
        "dir": -1
      }
    ],
    "table": {
      "header": [
        "Dec'25",
        "Dec'24",
        "Change(%)"
      ],
      "body": [
        {
          "field": "Net Sales",
          "val1": "1,031.11",
          "val2": "767.61",
          "chgp": "34.33%",
          "chgp_class": "positive"
        },
        {
          "field": "Operating Profit (PBDIT) excl Other Income",
          "val1": "35.96",
          "val2": "23.45",
          "chgp": "53.35%",
          "chgp_class": "positive"
        },
        {
          "field": "Interest",
          "val1": "29.10",
          "val2": "26.74",
          "chgp": "8.83%",
          "chgp_class": "negative"
        },
        {
          "field": "Exceptional Items",
          "val1": "0.00",
          "val2": "0.00",
          "chgp": "",
          "chgp_class": "neutral"
        },
        {
          "field": "Consolidate Net Profit",
          "val1": "-8.13",
          "val2": "22.75",
          "chgp": "-135.74%",
          "chgp_class": "negative"
        },
        {
          "field": "Operating Profit Margin (Excl OI)",
          "val1": "3.49%",
          "val2": "3.05%",
          "chgp": "0.44%",
          "chgp_class": "positive"
        }
      ]
    }
  },
  {
    "link": "annual",
    "btn_text": "All Annual Results",
    "header": "Annual Results Snapshot (Consolidated) - Mar'26",
    "rhs": [
      {
        "prefix": "Net Sales ",
        "suffix": "YoY Growth in year ended Mar 2026 is 39.78% vs 29.23% in Mar 2025",
        "dir": 1
      },
      {
        "prefix": "Consolidated Net Profit ",
        "suffix": "YoY Growth in year ended Mar 2026 is -73.81% vs 18.53% in Mar 2025",
        "dir": -1
      }
    ],
    "table": {
      "header": [
        "Mar'26",
        "Mar'25",
        "Change(%)"
      ],
      "body": [
        {
          "field": "Net Sales",
          "val1": "1,466.74",
          "val2": "1,049.33",
          "chgp": "39.78%",
          "chgp_class": "positive"
        },
        {
          "field": "Operating Profit (PBDIT) excl Other Income",
          "val1": "59.22",
          "val2": "33.53",
          "chgp": "76.62%",
          "chgp_class": "positive"
        },
        {
          "field": "Interest",
          "val1": "43.48",
          "val2": "35.90",
          "chgp": "21.11%",
          "chgp_class": "negative"
        },
        {
          "field": "Exceptional Items",
          "val1": "0.00",
          "val2": "0.00",
          "chgp": "",
          "chgp_class": "neutral"
        },
        {
          "field": "Consolidate Net Profit",
          "val1": "6.50",
          "val2": "24.82",
          "chgp": "-73.81%",
          "chgp_class": "negative"
        },
        {
          "field": "Operating Profit Margin (Excl OI)",
          "val1": "4.04%",
          "val2": "3.20%",
          "chgp": "0.84%",
          "chgp_class": "positive"
        }
      ]
    }
  }
]

Quarterly Results Snapshot (Consolidated) - Jun'26 - YoYstock-summary

Jun'26
Jun'25
Change(%)
Net Sales
541.43
310.60
74.32%
Operating Profit (PBDIT) excl Other Income
17.75
10.52
68.73%
Interest
8.61
8.96
-3.91%
Exceptional Items
0.00
0.00
Consolidate Net Profit
6.92
-3.30
309.70%
Operating Profit Margin (Excl OI)
3.28%
3.39%
-0.11%
Values in Rs Cr.
Direction Arrows
Net Sales

YoY Growth in quarter ended Jun 2026 is 74.32% vs 28.04% in Jun 2025

Direction Arrows
Consolidated Net Profit

YoY Growth in quarter ended Jun 2026 is 309.70% vs -132.87% in Jun 2025

Half Yearly Results Snapshot (Consolidated) - Sep'25stock-summary

Sep'25
Sep'24
Change(%)
Net Sales
674.27
494.04
36.48%
Operating Profit (PBDIT) excl Other Income
24.78
17.47
41.84%
Interest
19.23
17.35
10.84%
Exceptional Items
0.00
0.00
Consolidate Net Profit
-4.23
20.64
-120.49%
Operating Profit Margin (Excl OI)
3.68%
3.54%
0.14%
Values in Rs Cr.
Direction Arrows
Net Sales

Growth in half year ended Sep 2025 is 36.48% vs 26.38% in Sep 2024

Direction Arrows
Consolidated Net Profit

Growth in half year ended Sep 2025 is -120.49% vs 168.05% in Sep 2024

Nine Monthly Results Snapshot (Consolidated) - Dec'25stock-summary

Dec'25
Dec'24
Change(%)
Net Sales
1,031.11
767.61
34.33%
Operating Profit (PBDIT) excl Other Income
35.96
23.45
53.35%
Interest
29.10
26.74
8.83%
Exceptional Items
0.00
0.00
Consolidate Net Profit
-8.13
22.75
-135.74%
Operating Profit Margin (Excl OI)
3.49%
3.05%
0.44%
Values in Rs Cr.
Direction Arrows
Net Sales

YoY Growth in nine months ended Dec 2025 is 34.33% vs 31.77% in Dec 2024

Direction Arrows
Consolidated Net Profit

YoY Growth in nine months ended Dec 2025 is -135.74% vs 60.21% in Dec 2024

Annual Results Snapshot (Consolidated) - Mar'26stock-summary

Mar'26
Mar'25
Change(%)
Net Sales
1,466.74
1,049.33
39.78%
Operating Profit (PBDIT) excl Other Income
59.22
33.53
76.62%
Interest
43.48
35.90
21.11%
Exceptional Items
0.00
0.00
Consolidate Net Profit
6.50
24.82
-73.81%
Operating Profit Margin (Excl OI)
4.04%
3.20%
0.84%
Values in Rs Cr.
Direction Arrows
Net Sales

YoY Growth in year ended Mar 2026 is 39.78% vs 29.23% in Mar 2025

Direction Arrows
Consolidated Net Profit

YoY Growth in year ended Mar 2026 is -73.81% vs 18.53% in Mar 2025

stock-summaryCompany CV
About Bedmutha Industries Ltd stock-summary
stock-summary
Bedmutha Industries Ltd
Micro Cap
Iron & Steel Products
Bedmutha Industries Ltd was originally incorporated on August 23, 1990 as a private limited company with the name Bedmutha Wire Company Pvt Ltd. On September 23, 1997, the Company was converted into a public limited company and the name of the Company was changed to Bedmutha Wire Company Limited and thereafter to Bedmutha Industries Limited on November 18, 2009. Bedmutha is one of the leading steel wire manufacturers in Western India.
Company Coordinates stock-summary
Company Details
A 70/71/72 STICE Musalgaon, Sinnar Nashik Maharashtra : 422103
stock-summary
Tel: 91-2551-240481/631/068/069
stock-summary
cs@bedmutha.com
Registrar Details
Mondkar Computers Pvt Ltd , 21 Shakil Niwas , Opp. Satya Saibaba Temple, Mahakali Caves Road, Andheri (E), Mumbai