
Compare Beekay Steel Ind with Similar Stocks
Dashboard
Poor long term growth as Operating profit has grown by an annual rate -14.24% of over the last 5 years
The company has declared negative results for the last 8 consecutive quarters
Despite the size of the company, domestic mutual funds hold only 0% of the company
Underperformed the market in the last 1 year
Stock DNA
Iron & Steel Products
INR 763 Cr (Micro Cap)
21.00
26
0.25%
0.25
3.53%
0.73
Total Returns (Price + Dividend) 
Latest dividend: 1 per share ex-dividend date: Sep-15-2025
Risk Adjusted Returns v/s
Returns Beta

News

Beekay Steel Industries Ltd Faces Bearish Momentum Amid Technical Downgrade
Beekay Steel Industries Ltd, a micro-cap player in the Iron & Steel Products sector, has experienced a notable shift in its technical momentum, moving from a mildly bearish stance to a more pronounced bearish trend. Recent technical indicators, including MACD, RSI, and moving averages, signal increasing downside pressure, reflecting the stock’s struggle amid broader market challenges and sector-specific headwinds.
Read full news article
Beekay Steel Industries Ltd Upgraded to Sell on Technical Improvements Despite Weak Financials
Beekay Steel Industries Ltd has seen its investment rating upgraded from Strong Sell to Sell as of 8 June 2026, driven primarily by a shift in technical indicators despite ongoing financial headwinds. The company’s micro-cap status and sector challenges continue to weigh on its valuation and financial trend scores, but recent technical signals have improved, prompting a reassessment of its market stance.
Read full news article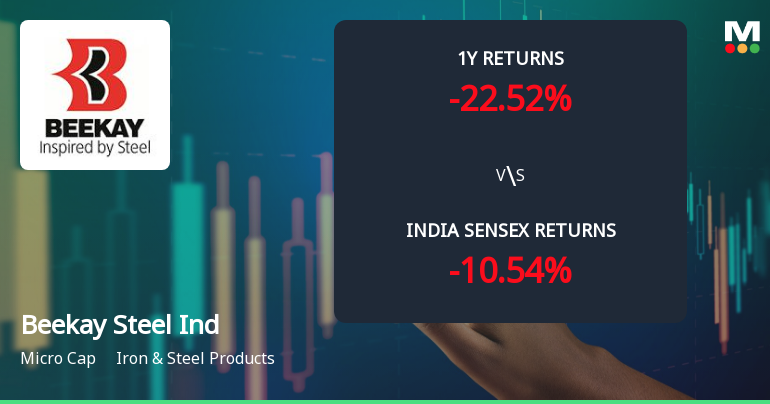
Beekay Steel Industries Ltd Sees Technical Momentum Shift Amid Mixed Market Signals
Beekay Steel Industries Ltd has experienced a subtle shift in its technical momentum, moving from a bearish to a mildly bearish trend, as reflected in recent price action and technical indicators. Despite a notable 5.11% gain in a single day, the stock’s broader technical signals present a complex picture, with mixed readings from MACD, RSI, Bollinger Bands, and moving averages, suggesting cautious optimism amid lingering bearish pressures.
Read full news article Announcements
Disclosures under Reg. 29(2) of SEBI (SAST) Regulations 2011
10-Jun-2026 | Source : BSEThe Exchange has received the disclosure under Regulation 29(2) of SEBI (Substantial Acquisition of Shares & Takeovers) Regulations 2011 for Century Vision Pvt Ltd
Disclosures under Reg. 29(2) of SEBI (SAST) Regulations 2011
10-Jun-2026 | Source : BSEThe Exchange has received the disclosure under Regulation 29(2) of SEBI (Substantial Acquisition of Shares & Takeovers) Regulations 2011 for Century Vision Pvt Ltd
Announcement under Regulation 30 (LODR)-Newspaper Publication
02-Jun-2026 | Source : BSENewspaper Publication - 3rd Reminder - Opening of Special Window for transfer & dematerialisation of physical securities- SEBI Circular dt:30.01.2026.
Corporate Actions

No Upcoming Board Meetings

Beekay Steel Industries Ltd has declared 10% dividend, ex-date: 15 Sep 25

No Splits history available

No Bonus history available

No Rights history available
Quality key factors
Valuation key factors
Technicals key factors
 Technical Indicator Scale: Bearish, Mildly Bearish, Sideways, Mildly Bullish, Bullish Turned
 Shareholding Snapshot : Mar 2026
Shareholding Compare (%holding)
Promoters
None
Held by 0 Schemes
Held by 1 FIIs (0.0%)
Century Vision Pvt. Ltd. (19.21%)
Jyotirmay Trading Private Limited (12.89%)
8.3%
Quarterly Results Snapshot (Consolidated) - Mar'26 - QoQ

QoQ Growth in quarter ended Mar 2026 is 17.61% vs 8.38% in Dec 2025

QoQ Growth in quarter ended Mar 2026 is -245.23% vs 19.00% in Dec 2025
Half Yearly Results Snapshot (Consolidated) - Sep'25
Growth in half year ended Sep 2025 is 15.51% vs -8.15% in Sep 2024
Growth in half year ended Sep 2025 is -32.58% vs -5.31% in Sep 2024
Nine Monthly Results Snapshot (Consolidated) - Dec'25
YoY Growth in nine months ended Dec 2025 is 12.14% vs -0.17% in Dec 2024
YoY Growth in nine months ended Dec 2025 is -32.57% vs -10.25% in Dec 2024
Annual Results Snapshot (Consolidated) - Mar'26
YoY Growth in year ended Mar 2026 is 9.17% vs 7.58% in Mar 2025
YoY Growth in year ended Mar 2026 is -58.86% vs -31.87% in Mar 2025
About Beekay Steel Industries Ltd

Company Coordinates


