Benares Hotels

  • Market Cap: Micro Cap
  • Industry: Hotels & Resorts
  • ISIN: INE664D01019
  • NSEID: BENARAS
  • BSEID: 509438
INR
10,122.00
0.00 (0.00%)
BSENSE

Aug 28, 03:30 PM

BSE+NSE Vol: 13

  • Price Points
  • Score
  • Mojo Parameters
  • Total Return
  • News and Corporate Actions
  • Key factors
  • Shareholding
  • Financials
  • CompanyCV
stock-summaryPrice Point
High/Low

1Day

52 Week

Valuation
Technical
Day's Volume

CASH

13 (-65.05%) Volume

Shareholding (Jun 2026)

FII

0.01%

Held by 2 FIIs

DII

0.05%

Held by 0 DIIs

Promoter

62.58%

Why is Benares Hotels Ltd falling/rising?

31-Aug-2026

As of 30-Aug, Benares Hotels Ltd's stock price is at 10,199.95, reflecting a slight decline and negative short-term momentum. Despite a year-to-date increase of +6.65%, recent trading activity indicates waning investor interest and downward pressure on the stock.

As of 30-Aug, Benares Hotels Ltd's stock price is experiencing a slight decline, currently at 10,199.95, with a change of -0.05 (0.00%). The stock has been on a downward trend, having lost -1.92% over the last four days. This consecutive fall indicates a negative momentum in the short term. <BR><BR>While the stock has outperformed its sector by 1.46% today, it is important to note that it has underperformed against the benchmark Sensex over the past week, which has seen a decline of -0.36%. Additionally, the stock's performance over the last month shows a decrease of -0.21%, contrasting with the Sensex's increase of +0.65%. <BR><BR>Investor participation appears to be waning, as evidenced by a significant drop in delivery volume, which fell by -53.8% compared to the 5-day average. This decline in trading activity may contribute to the stock's inability to maintain upward momentum. <BR><BR>Despite these short-term challenges, Benares Hotels Ltd has shown strong performance over longer periods, with a year-to-date increase of +6.65% and a remarkable +551.77% rise over the past five years. However, the current conditions suggest that the stock is facing downward pressure in the immediate term.

View full answer

Should I buy, sell or hold Benares Hotels Ltd?

25-Aug-2026

Who are in the management team of Benares Hotels?

14-Aug-2026

The management team of Benares Hotels includes Anantnarain Singh (Chairman), Rukmani Devi, Rohit Khosla, Vanika Mahajan (Company Secretary), Moiz Miyajiwala, Puneet Raman, and Bejal Akshaykumar Desai.

The management team of Benares Hotels includes the following individuals:<BR><BR>1. **Anantnarain Singh** - Chairman (Non-Executive)<BR>2. **Rukmani Devi** - Independent Director<BR>3. **Rohit Khosla** - Director<BR>4. **Vanika Mahajan** - Company Secretary & Compliance Officer<BR>5. **Moiz Miyajiwala** - Independent Director<BR>6. **Puneet Raman** - Independent Director<BR>7. **Bejal Akshaykumar Desai** - Director<BR><BR>If you have any more questions about the company or its management, feel free to ask!

View full answer

What does Benares Hotels do?

14-Aug-2026

Benares Hotels Ltd operates in the hotel industry, primarily in Varanasi, Uttar Pradesh, and reported net sales of 34 Cr and a net profit of 8 Cr for June 2026. The company is classified as a Micro Cap with a market cap of INR 1,332 Cr.

Overview:<BR>Benares Hotels Ltd operates in the hotel business within the Hotels & Resorts industry and is classified as a Micro Cap company.<BR><BR>History:<BR>Incorporated in 1971 and promoted by Anant Narain Singh, Benares Hotels Ltd has been involved in the hotel sector in Varanasi, Uttar Pradesh. The latest quarterly results reported net sales and profit for June 2026.<BR><BR>Financial Snapshot:<BR>Net Sales: 34 Cr (Quarterly Results - Jun 2026) <BR>Net Profit: 8 Cr (Quarterly Results - Jun 2026) <BR>Market Cap: INR 1,332 Cr (Micro Cap)<BR><BR>Key Metrics:<BR>P/E: 30.00 <BR>Industry P/E: 36 <BR>Dividend Yield: 0.25% <BR>Debt-Equity: -0.36 <BR>Return on Equity: 20.70% <BR>Price to Book: 6.24 <BR><BR>Contact Details:<BR>Address: Nadesar Palace Compound, Varanasi Uttar Pradesh: 221002 <BR>Tel: 91-0542-6660001 <BR>Email: investorrelatios@tajhotels.com <BR>Website: http://www.benareshotelslimited.com

View full answer

Who are the peers of the Benares Hotels?

14-Aug-2026

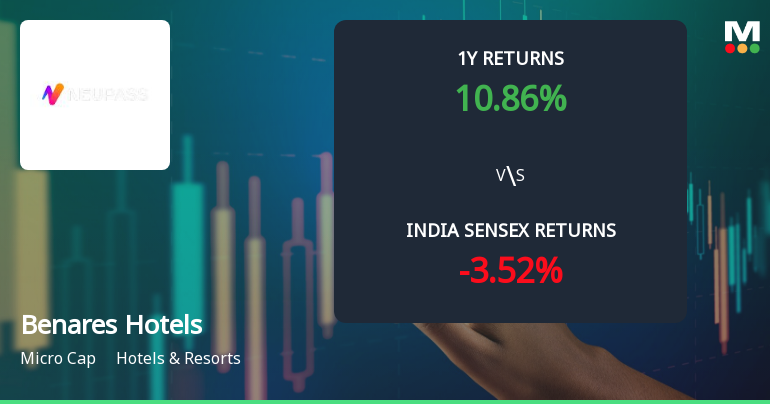
Benares Hotels' peers include Apeejay Surrend., Oriental Hotels, Brigade Hotel, TajGVK Hotels, EIH Assoc.Hotels, Asian Hotels (N), Mac Charles(I), Viceroy Hotels, and Royal Orch.Hotel. Benares Hotels shows excellent growth and average management risk, with a 1-year return of 10.05%, outperforming Brigade Hotel but underperforming Viceroy Hotels, which has the highest return at 25.26%.

Peers: The peers of Benares Hotels are Apeejay Surrend., Oriental Hotels, Brigade Hotel, TajGVK Hotels, EIH Assoc.Hotels, Asian Hotels (N), Mac Charles(I), Viceroy Hotels, Royal Orch.Hotel.<BR><BR>Quality Snapshot: Excellent management risk is observed at TajGVK Hotels and EIH Assoc.Hotels, while Average management risk is found at Apeejay Surrend., Brigade Hotel, Benares Hotels, Asian Hotels (N), and Royal Orch.Hotel, and the rest. Growth is Excellent at Benares Hotels and TajGVK Hotels, Good at Oriental Hotels, EIH Assoc.Hotels, Viceroy Hotels, and Asian Hotels (N), while Below Average growth is seen at Brigade Hotel and Mac Charles(I). Capital Structure is Excellent at TajGVK Hotels and EIH Assoc.Hotels, Good at Apeejay Surrend. and Brigade Hotel, Average at Oriental Hotels, and Below Average at Asian Hotels (N), Mac Charles(I), Viceroy Hotels, and Royal Orch.Hotel.<BR><BR>Return Snapshot: The peer with the highest 1-year return is Viceroy Hotels at 25.26%, while Brigade Hotel has the lowest at -28.43%. Benares Hotels has a 1-year return of 10.05%, which is significantly higher than Brigade Hotel but lower than Viceroy Hotels. Additionally, EIH Assoc.Hotels, Mac Charles(I), and Royal Orch.Hotel all have negative six-month returns.

View full answer

How big is Benares Hotels?

14-Aug-2026

As of 14th August, Benares Hotels Ltd has a market capitalization of 1,318.00 Cr, with recent net sales of 148.02 Cr and net profit of 43.91 Cr over the last four quarters.

As of 14th August, <BR><BR>Market Cap: Benares Hotels Ltd has a market capitalization of 1,318.00 Cr, categorizing it as a Micro Cap company.<BR><BR>Recent Quarterly Performance: The sum of Net Sales for the latest 4 quarters is 148.02 Cr, while the sum of Net Profit for the same period is 43.91 Cr.<BR><BR>Balance Sheet Snapshot: The reporting period for the balance sheet is March 2026. Shareholder's Funds stand at 212.63 Cr, and Total Assets are valued at 256.79 Cr.

View full answer

Are Benares Hotels Ltd latest results good or bad?

15-Jul-2026

Benares Hotels Ltd's latest results show strong year-on-year growth in net sales and profit, but significant sequential declines due to seasonal fluctuations in the hospitality sector. Overall, the performance is good year-on-year but raises concerns when comparing quarter-on-quarter results.

Benares Hotels Ltd's latest results reflect a mixed performance, primarily influenced by the seasonal nature of the hospitality business in Varanasi. In the quarter ended June 2026, the company reported net sales of ₹33.89 crores, which is a significant year-on-year increase of 35.51%. However, this figure represents a sequential decline of 30.27% from the previous quarter, which is typical during the lean travel season.<BR><BR>The net profit for the quarter was ₹8.25 crores, showing a year-on-year increase of 8.85%, but a sharp decline of 46.26% compared to the previous quarter. Operating margins also contracted to 36.88%, down from 44.92% in the prior quarter, indicating challenges in managing fixed costs during off-peak periods.<BR><BR>Despite these challenges, the company maintains a debt-free status and has generated healthy cash flows, which supports a strong balance sheet. The year-on-year growth in revenue indicates that Benares Hotels is successfully capitalizing on the recovery in domestic tourism and premiumization trends in the hospitality sector.<BR><BR>In summary, while the results show strong year-on-year growth, the sequential declines in both sales and profit highlight the impact of seasonal fluctuations in the business. Overall, the performance can be seen as good in the context of year-on-year growth but concerning when looking at the quarter-on-quarter results.

View full answer

When is the next results date for Benares Hotels Ltd?

09-Jul-2026

The next results date for Benares Hotels Ltd is 14 July 2026.

The next results date for Benares Hotels Ltd is scheduled for 14 July 2026.

View full answer

How has been the historical performance of Benares Hotels?

16-Oct-2025

Benares Hotels has shown significant growth from Mar'21 to Mar'25, with net sales increasing from 24.24 Cr to 135.47 Cr, and profit before tax improving from a loss of 6.97 Cr to a profit of 58.11 Cr. Overall, the company has demonstrated remarkable financial performance with rising revenues, profitability, and asset growth.

Answer:<BR>The historical performance of Benares Hotels shows significant growth in net sales and profitability over the years.<BR><BR>Breakdown:<BR>Benares Hotels has demonstrated a strong upward trend in net sales, increasing from 24.24 Cr in Mar'21 to 135.47 Cr in Mar'25. Total operating income followed a similar trajectory, rising from 49.84 Cr in Mar'22 to 135.47 Cr in Mar'25. The company's operating profit (PBDIT) also saw substantial growth, reaching 64.52 Cr in Mar'25, up from just 0.39 Cr in Mar'21. Profit before tax increased from a loss of 6.97 Cr in Mar'21 to 58.11 Cr in Mar'25, while profit after tax improved from a loss of 5.23 Cr in Mar'21 to 43.25 Cr in Mar'25. The earnings per share (EPS) reflected this positive trend, rising from -40.23 in Mar'21 to 332.69 in Mar'25. On the balance sheet, total assets grew from 90.89 Cr in Mar'21 to 195.39 Cr in Mar'25, with total liabilities also increasing from 90.89 Cr to 195.39 Cr during the same period. Cash flow from operating activities improved significantly, reaching 41 Cr in Mar'25 compared to just 2 Cr in Mar'21. Overall, Benares Hotels has shown remarkable improvement in financial performance, marked by increasing revenues, profitability, and asset growth.

View full answer

Is Benares Hotels technically bullish or bearish?

19-Sep-2025

As of September 18, 2025, Benares Hotels is in a mildly bearish trend, with bearish signals from the weekly MACD and daily moving averages, despite bullish Bollinger Bands, indicating caution in the near term.

As of 18 September 2025, the technical trend for Benares Hotels has changed from sideways to mildly bearish. The current stance is mildly bearish, driven primarily by the weekly MACD indicating a bearish signal and the daily moving averages also showing a mildly bearish trend. While the Bollinger Bands are bullish on both weekly and monthly time frames, the overall sentiment is tempered by the monthly KST and Dow Theory both being mildly bearish. The RSI shows no signal on both weekly and monthly charts, indicating a lack of momentum. Despite the recent strong returns compared to the Sensex, the technical indicators suggest caution in the near term.

View full answer

Is Benares Hotels overvalued or undervalued?

09-Jun-2025

As of November 20, 2023, Benares Hotels is considered very expensive with a PE ratio of 29.99 and other high valuation metrics, indicating it may be overvalued despite a strong year-to-date return of 23.53%.

As of 20 November 2023, Benares Hotels has moved from an expensive to a very expensive valuation grade. The company is currently overvalued, with a PE ratio of 29.99, a Price to Book Value of 7.51, and an EV to EBITDA of 20.42. These ratios indicate that the stock is trading at a premium compared to its earnings and assets.<BR><BR>In comparison to its peers, Benares Hotels' PE ratio is significantly lower than that of Indian Hotels Co, which has a PE of 66.81, and ITC Hotels at 65.26, both of which are also classified as very expensive. However, its EV to EBITDA ratio is more favorable than EIH's 22.27. Despite recent stock performance showing a 23.53% return year-to-date compared to the Sensex's 5.63%, the high valuation metrics suggest that Benares Hotels may not sustain its current price levels in the long term.

View full answer

Who are the top shareholders of the Benares Hotels?

06-Jun-2025

The top shareholders of Benares Hotels include The Indian Hotels Company Limited with 49.53%, individual investors at 30.55% (led by Aditya Deorah at 2.79%), and a foreign institutional investor with 0.01%. There are no pledged promoter holdings or mutual fund investments in the company.

The top shareholders of Benares Hotels include The Indian Hotels Company Limited, which holds a significant 49.53% of the shares. Individual investors collectively own 30.55%, with Aditya Deorah being the highest public shareholder at 2.79%. Additionally, there is one foreign institutional investor (FII) that holds a very small percentage of 0.01%. Notably, there are no pledged promoter holdings and no mutual funds currently invested in the company.

View full answer

Has Benares Hotels declared dividend?

06-Jun-2025

Benares Hotels Ltd has declared a 250% dividend, amounting to ₹25 per share, with an ex-date of August 22, 2024. The dividend yield is 0.25%, and the company has shown strong total returns across various periods, particularly in price appreciation.

Benares Hotels Ltd has declared a 250% dividend.<BR><BR>Dividend Details:<BR>- Percentage announced: 250%<BR>- Amount per share: 25<BR>- Ex-date: 22 Aug 24<BR><BR>Dividend Yield: 0.25%.<BR><BR>Total Returns by Period:<BR>In the last 6 months, the price return was 21.67%, with a dividend return of 0%, resulting in a total return of 21.67%.<BR><BR>Over the past year, the price return was 13.46%, the dividend return was 0.28%, leading to a total return of 13.74%.<BR><BR>In the 2-year period, the price return reached 148.64%, with a dividend return of 1.03%, culminating in a total return of 149.67%.<BR><BR>For the 3-year period, the price return was an impressive 415.62%, while the dividend return stood at 3.21%, resulting in a total return of 418.83%.<BR><BR>Over the last 4 years, the price return was 606.85%, with a dividend return of 3.56%, leading to a total return of 610.41%.<BR><BR>In the 5-year period, the price return was 644.96%, and the dividend return was 4.98%, giving a total return of 649.94%.<BR><BR>Overall, Benares Hotels has declared a significant dividend while also demonstrating strong total returns across various periods, particularly in terms of price appreciation. The dividend yield, although modest, reflects a consistent return to shareholders.

View full answer
iScoreScore
Click here to find our call on this stock
Strong Sell
Sell
Hold
Buy
Strong Buy

Dashboard

1

The company is Net-Debt Free

 
2

Healthy long term growth as Net Sales has grown by an annual rate of 40.00% and Operating profit at 72.59%

 
3

Flat results in Jun 26

4

With ROE of 20.7, it has a Very Expensive valuation with a 6.2 Price to Book Value

5

Majority shareholders : Promoters

 
stock-summaryMojo Parameters

Mojo Parameters

Loading Valuation Snapshot...

Stock DNA

stock-summary
Industry

Hotels & Resorts

stock-summary
Market cap

INR Cr (Micro Cap)

stock-summary
P/E

30.00

stock-summary
Industry P/E

NA

stock-summary
Dividend Yield

0.00%

stock-summary
Debt Equity

0.00

stock-summary
Return on Equity

0.00%

stock-summary
Price to Book

0.00

Revenue and Profits:
Net Sales:
34 Cr
(Quarterly Results - Jun 2026)
Net Profit:
8 Cr
stock-summaryTotal Returns
Total Returns (Price + Dividend) stock-summary
Icon
Company does not have enough history
Risk Adjusted Returns v/s stock-summary
Returns Beta
Icon
Beta has not been calculated since enough price history is not available
stock-summaryNews & Corporate Actions

News

stock-summaryKey Factors

Quality key factors stock-summary

Factor
Value
Sales Growth (5y)
40.00%
EBIT Growth (5y)
72.59%
EBIT to Interest (avg)
40.49
Debt to EBITDA (avg)
0.19
Net Debt to Equity (avg)
-0.36
Sales to Capital Employed (avg)
0.76
Tax Ratio
25.50%
Dividend Payout Ratio
7.52%
Pledged Shares
0
Institutional Holding
0.07%
ROCE (avg)
38.92%
ROE (avg)
20.64%

Valuation key factors

Factor
Value
P/E Ratio
30
Industry P/E
36
Price to Book Value
6.24
EV to EBIT
23.05
EV to EBITDA
20.11
EV to Capital Employed
9.21
EV to Sales
8.44
PEG Ratio
NA
Dividend Yield
0.25%
ROCE (Latest)
38.94%
ROE (Latest)
20.70%

Technicals key factors

Indicator
Weekly
Monthly
MACD
Mildly Bearish
Mildly Bearish
RSI
No Signal
No Signal
Bollinger Bands
Sideways
Mildly Bullish
Moving Averages
Mildly Bullish (Daily)
KST
Mildly Bearish
Mildly Bearish
Dow Theory
No Trend
Mildly Bearish
OBV
No Trend
No Trend
stock-summary Technical Indicator Scale: Bearish, Mildly Bearish, Sideways, Mildly Bullish, Bullish  Turned 
stock-summaryShareholding
Shareholding Snapshot : Jun 2026stock-summary
Shareholding Compare (%holding) stock-summary
Majority shareholders

Promoters

Pledged Promoter Holdings

None

Mutual Funds

Held by 0 Schemes

FIIs

Held by 2 FIIs (0.01%)

Promoter with highest holding

The Indian Hotels Company Limited (49.53%)

Highest Public shareholder

Aditya Deorah (2.87%)

Individual Investors Holdings

30.4%

stock-summaryFinancial
[
  {
    "link": "quarterly",
    "btn_text": "All Quarterly Results",
    "header": "Quarterly Results Snapshot (Standalone) - Jun'26 - YoY",
    "rhs": [
      {
        "prefix": "Net Sales ",
        "suffix": "YoY Growth in quarter ended Jun 2026 is 35.51% vs 8.74% in Jun 2025",
        "dir": 1
      },
      {
        "prefix": "Standalone Net Profit ",
        "suffix": "YoY Growth in quarter ended Jun 2026 is 8.84% vs 17.88% in Jun 2025",
        "dir": -1
      }
    ],
    "table": {
      "header": [
        "Jun'26",
        "Jun'25",
        "Change(%)"
      ],
      "body": [
        {
          "field": "Net Sales",
          "val1": "33.89",
          "val2": "25.01",
          "chgp": "35.51%",
          "chgp_class": "positive"
        },
        {
          "field": "Operating Profit (PBDIT) excl Other Income",
          "val1": "12.50",
          "val2": "10.02",
          "chgp": "24.75%",
          "chgp_class": "positive"
        },
        {
          "field": "Interest",
          "val1": "0.12",
          "val2": "0.10",
          "chgp": "20.00%",
          "chgp_class": "negative"
        },
        {
          "field": "Exceptional Items",
          "val1": "0.00",
          "val2": "0.00",
          "chgp": "",
          "chgp_class": "neutral"
        },
        {
          "field": "Standalone Net Profit",
          "val1": "8.25",
          "val2": "7.58",
          "chgp": "8.84%",
          "chgp_class": "positive"
        },
        {
          "field": "Operating Profit Margin (Excl OI)",
          "val1": "36.88%",
          "val2": "40.06%",
          "chgp": "-3.18%",
          "chgp_class": "negative"
        }
      ]
    }
  },
  {
    "link": "half-yearly",
    "btn_text": "All Half Yearly Results",
    "header": "Half Yearly Results Snapshot (Standalone) - Sep'25",
    "rhs": [
      {
        "prefix": "Net Sales ",
        "suffix": " Growth in half year ended Sep 2025 is 3.01% vs -7.57% in Sep 2024",
        "dir": 1
      },
      {
        "prefix": "Standalone Net Profit ",
        "suffix": " Growth in half year ended Sep 2025 is 0.22% vs 3.73% in Sep 2024",
        "dir": -1
      }
    ],
    "table": {
      "header": [
        "Sep'25",
        "Sep'24",
        "Change(%)"
      ],
      "body": [
        {
          "field": "Net Sales",
          "val1": "48.91",
          "val2": "47.48",
          "chgp": "3.01%",
          "chgp_class": "positive"
        },
        {
          "field": "Operating Profit (PBDIT) excl Other Income",
          "val1": "18.26",
          "val2": "18.91",
          "chgp": "-3.44%",
          "chgp_class": "negative"
        },
        {
          "field": "Interest",
          "val1": "0.19",
          "val2": "0.19",
          "chgp": "",
          "chgp_class": "neutral"
        },
        {
          "field": "Exceptional Items",
          "val1": "0.00",
          "val2": "0.00",
          "chgp": "",
          "chgp_class": "neutral"
        },
        {
          "field": "Standalone Net Profit",
          "val1": "13.66",
          "val2": "13.63",
          "chgp": "0.22%",
          "chgp_class": "positive"
        },
        {
          "field": "Operating Profit Margin (Excl OI)",
          "val1": "37.33%",
          "val2": "39.83%",
          "chgp": "-2.50%",
          "chgp_class": "negative"
        }
      ]
    }
  },
  {
    "link": "nine-monthly",
    "btn_text": "All Nine Monthly Results",
    "header": "Nine Monthly Results Snapshot (Standalone) - Dec'25",
    "rhs": [
      {
        "prefix": "Net Sales ",
        "suffix": "YoY Growth in nine months ended Dec 2025 is 4.85% vs 1.61% in Dec 2024",
        "dir": 1
      },
      {
        "prefix": "Standalone Net Profit ",
        "suffix": "YoY Growth in nine months ended Dec 2025 is 2.57% vs 11.25% in Dec 2024",
        "dir": -1
      }
    ],
    "table": {
      "header": [
        "Dec'25",
        "Dec'24",
        "Change(%)"
      ],
      "body": [
        {
          "field": "Net Sales",
          "val1": "90.54",
          "val2": "86.35",
          "chgp": "4.85%",
          "chgp_class": "positive"
        },
        {
          "field": "Operating Profit (PBDIT) excl Other Income",
          "val1": "37.80",
          "val2": "37.60",
          "chgp": "0.53%",
          "chgp_class": "positive"
        },
        {
          "field": "Interest",
          "val1": "0.29",
          "val2": "0.29",
          "chgp": "",
          "chgp_class": "neutral"
        },
        {
          "field": "Exceptional Items",
          "val1": "-0.13",
          "val2": "0.00",
          "chgp": "",
          "chgp_class": "neutral"
        },
        {
          "field": "Standalone Net Profit",
          "val1": "27.89",
          "val2": "27.19",
          "chgp": "2.57%",
          "chgp_class": "positive"
        },
        {
          "field": "Operating Profit Margin (Excl OI)",
          "val1": "41.75%",
          "val2": "43.54%",
          "chgp": "-1.79%",
          "chgp_class": "negative"
        }
      ]
    }
  },
  {
    "link": "annual",
    "btn_text": "All Annual Results",
    "header": "Annual Results Snapshot (Standalone) - Mar'26",
    "rhs": [
      {
        "prefix": "Net Sales ",
        "suffix": "YoY Growth in year ended Mar 2026 is 2.71% vs 12.37% in Mar 2025",
        "dir": -1
      },
      {
        "prefix": "Standalone Net Profit ",
        "suffix": "YoY Growth in year ended Mar 2026 is -0.02% vs 20.01% in Mar 2025",
        "dir": -1
      }
    ],
    "table": {
      "header": [
        "Mar'26",
        "Mar'25",
        "Change(%)"
      ],
      "body": [
        {
          "field": "Net Sales",
          "val1": "139.14",
          "val2": "135.47",
          "chgp": "2.71%",
          "chgp_class": "positive"
        },
        {
          "field": "Operating Profit (PBDIT) excl Other Income",
          "val1": "59.63",
          "val2": "59.32",
          "chgp": "0.52%",
          "chgp_class": "positive"
        },
        {
          "field": "Interest",
          "val1": "0.39",
          "val2": "0.38",
          "chgp": "2.63%",
          "chgp_class": "negative"
        },
        {
          "field": "Exceptional Items",
          "val1": "-0.13",
          "val2": "0.00",
          "chgp": "",
          "chgp_class": "neutral"
        },
        {
          "field": "Standalone Net Profit",
          "val1": "43.24",
          "val2": "43.25",
          "chgp": "-0.02%",
          "chgp_class": "negative"
        },
        {
          "field": "Operating Profit Margin (Excl OI)",
          "val1": "42.86%",
          "val2": "43.79%",
          "chgp": "-0.93%",
          "chgp_class": "negative"
        }
      ]
    }
  }
]

Quarterly Results Snapshot (Standalone) - Jun'26 - YoYstock-summary

Jun'26
Jun'25
Change(%)
Net Sales
33.89
25.01
35.51%
Operating Profit (PBDIT) excl Other Income
12.50
10.02
24.75%
Interest
0.12
0.10
20.00%
Exceptional Items
0.00
0.00
Standalone Net Profit
8.25
7.58
8.84%
Operating Profit Margin (Excl OI)
36.88%
40.06%
-3.18%
Values in Rs Cr.
Direction Arrows
Net Sales

YoY Growth in quarter ended Jun 2026 is 35.51% vs 8.74% in Jun 2025

Direction Arrows
Standalone Net Profit

YoY Growth in quarter ended Jun 2026 is 8.84% vs 17.88% in Jun 2025

Half Yearly Results Snapshot (Standalone) - Sep'25stock-summary

Sep'25
Sep'24
Change(%)
Net Sales
48.91
47.48
3.01%
Operating Profit (PBDIT) excl Other Income
18.26
18.91
-3.44%
Interest
0.19
0.19
Exceptional Items
0.00
0.00
Standalone Net Profit
13.66
13.63
0.22%
Operating Profit Margin (Excl OI)
37.33%
39.83%
-2.50%
Values in Rs Cr.
Direction Arrows
Net Sales

Growth in half year ended Sep 2025 is 3.01% vs -7.57% in Sep 2024

Direction Arrows
Standalone Net Profit

Growth in half year ended Sep 2025 is 0.22% vs 3.73% in Sep 2024

Nine Monthly Results Snapshot (Standalone) - Dec'25stock-summary

Dec'25
Dec'24
Change(%)
Net Sales
90.54
86.35
4.85%
Operating Profit (PBDIT) excl Other Income
37.80
37.60
0.53%
Interest
0.29
0.29
Exceptional Items
-0.13
0.00
Standalone Net Profit
27.89
27.19
2.57%
Operating Profit Margin (Excl OI)
41.75%
43.54%
-1.79%
Values in Rs Cr.
Direction Arrows
Net Sales

YoY Growth in nine months ended Dec 2025 is 4.85% vs 1.61% in Dec 2024

Direction Arrows
Standalone Net Profit

YoY Growth in nine months ended Dec 2025 is 2.57% vs 11.25% in Dec 2024

Annual Results Snapshot (Standalone) - Mar'26stock-summary

Mar'26
Mar'25
Change(%)
Net Sales
139.14
135.47
2.71%
Operating Profit (PBDIT) excl Other Income
59.63
59.32
0.52%
Interest
0.39
0.38
2.63%
Exceptional Items
-0.13
0.00
Standalone Net Profit
43.24
43.25
-0.02%
Operating Profit Margin (Excl OI)
42.86%
43.79%
-0.93%
Values in Rs Cr.
Direction Arrows
Net Sales

YoY Growth in year ended Mar 2026 is 2.71% vs 12.37% in Mar 2025

Direction Arrows
Standalone Net Profit

YoY Growth in year ended Mar 2026 is -0.02% vs 20.01% in Mar 2025

stock-summaryCompany CV
About Benares Hotels Ltd stock-summary
stock-summary
Benares Hotels Ltd
Micro Cap
Hotels & Resorts
Incorporated in 1971 and promoted by Anant Narain Singh, Benares Hotels Limited (BHL) is in the hotel business in Varanasi, Uttar Pradesh. The Company operates its hotels, viz. Taj Ganges and Taj Nadesar Palace in Varanasi and The Ginger Hotel, Gondia in Maharashtra. (Earlier, The Gateway Hotel Balaghat Road, Gondia) in Maharashtra. The Indian Hotels Company Limited (IHCL) is the ultimate Holding Company of BHL. In Mar.
Company Coordinates stock-summary
Company Details
Nadesar Palace Compound , Varanasi Uttar Pradesh : 221002
stock-summary
Tel: 91-0542-6660001
stock-summary
investorrelatios@tajhotels.com
Registrar Details
The Indian Hotels Company Limited, Mandlik House,, Mandlik Road, Mumbai