
Compare Bhageria Indust. with Similar Stocks
Dashboard
Company has a Debt to Equity ratio (avg) of 0.03 times
Poor long term growth as Operating profit has grown by an annual rate -5.49% of over the last 5 years
The company has declared Positive results for the last 10 consecutive quarters
With ROCE of 8.8, it has a Fair valuation with a 1.5 Enterprise value to Capital Employed
Despite the size of the company, domestic mutual funds hold only 0% of the company
Market Beating performance in long term as well as near term
Stock DNA
Dyes And Pigments
INR 934 Cr (Micro Cap)
20.00
22
0.70%
0.12
7.72%
1.56
Total Returns (Price + Dividend) 
Latest dividend: 1.5 per share ex-dividend date: Jul-25-2025
Risk Adjusted Returns v/s
Returns Beta

News
When is the next results date for Bhageria Industries Ltd?
The next results date for Bhageria Industries Ltd is scheduled for 22 July 2026....
Read full news article
Bhageria Industries Ltd is Rated Hold by MarketsMOJO
Bhageria Industries Ltd is rated 'Hold' by MarketsMOJO, with this rating last updated on 25 May 2026. While the rating was revised on that date, the analysis and financial metrics discussed here reflect the stock's current position as of 12 July 2026, providing investors with an up-to-date perspective on the company’s fundamentals, valuation, financial trends, and technical outlook.
Read full news article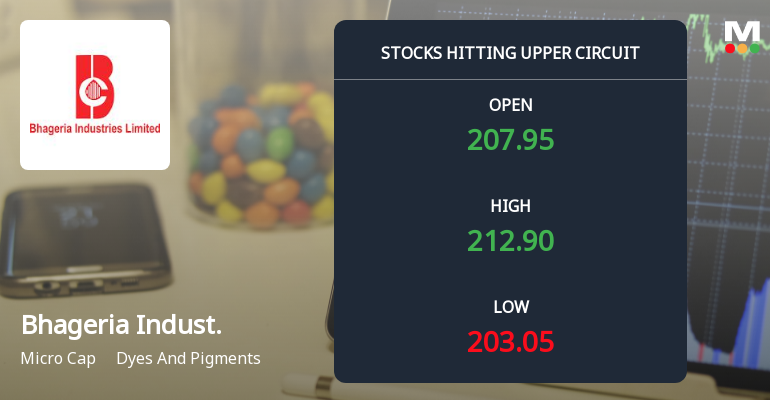
Bhageria Industries Ltd Locks at Upper Circuit With 5% Gain — Buyers Queue, Sellers Absent
At Rs 213.83, the buying was done — not because demand dried up, but because the exchange wouldn't let the stock go any higher. Bhageria Industries Ltd locked at its upper circuit of 5% on 09 Jul 2026, with buyers queuing and no sellers willing to part with shares.
Read full news article Announcements
Bhageria Industries Limited - Investor Presentation
14-Nov-2019 | Source : NSEBhageria Industries Limited has informed the Exchange regarding Investor Presentation
Bhageria Industries Limited - Outcome of Board Meeting
22-Oct-2019 | Source : NSEBhageria Industries Limited has informed the Exchange regarding Board meeting held on October 21, 2019.
Shareholders meeting
31-Aug-2019 | Source : NSE
| Bhageria Industries Limited has informed the Exchange regarding Proceedings of Annual General Meeting held on August 31, 2019. Further, the company has submitted the Exchange a copy of Srutinizers report along with voting results. |
Corporate Actions

22 Jul 2026

Bhageria Industries Ltd has declared 50% dividend, ex-date: 24 Jul 26

Bhageria Industries Ltd has announced 5:10 stock split, ex-date: 26 Oct 16

Bhageria Industries Ltd has announced 1:1 bonus issue, ex-date: 17 Jul 19

No Rights history available
Quality key factors
Valuation key factors
Technicals key factors
 Technical Indicator Scale: Bearish, Mildly Bearish, Sideways, Mildly Bullish, Bullish Turned
 Shareholding Snapshot : Jun 2026
Shareholding Compare (%holding)
Promoters
None
Held by 0 Schemes
Held by 4 FIIs (0.05%)
Bhageria Trade Invest Pvt Ltd (15.16%)
None
14.87%
Quarterly Results Snapshot (Consolidated) - Mar'26 - QoQ

QoQ Growth in quarter ended Mar 2026 is 12.01% vs 18.18% in Dec 2025

QoQ Growth in quarter ended Mar 2026 is 5.72% vs -5.09% in Dec 2025
Half Yearly Results Snapshot (Consolidated) - Sep'25
Growth in half year ended Sep 2025 is 49.76% vs 20.78% in Sep 2024
Growth in half year ended Sep 2025 is 84.48% vs 210.95% in Sep 2024
Nine Monthly Results Snapshot (Consolidated) - Dec'25
YoY Growth in nine months ended Dec 2025 is 46.47% vs 32.03% in Dec 2024
YoY Growth in nine months ended Dec 2025 is 38.95% vs 100.73% in Dec 2024
Annual Results Snapshot (Consolidated) - Mar'26
YoY Growth in year ended Mar 2026 is 46.98% vs 20.29% in Mar 2025
YoY Growth in year ended Mar 2026 is 14.06% vs 111.85% in Mar 2025
About Bhageria Industries Ltd

Company Coordinates


