Bodal Chemicals

  • Market Cap: Micro Cap
  • Industry: Dyes And Pigments
  • ISIN: INE338D01028
  • NSEID: BODALCHEM
  • BSEID: 524370
INR
197.71
6.48 (3.39%)
BSENSE

Sep 21, 03:30 PM

BSE+NSE Vol: 39.2 lacs

  • Price Points
  • Score
  • Mojo Parameters
  • Total Return
  • News and Corporate Actions
  • Key factors
  • Shareholding
  • Financials
  • CompanyCV
stock-summaryPrice Point
High/Low

1Day

52 Week

Valuation
Technical
Day's Volume

CASH

39.2 lacs (45.49%) Volume

Shareholding (Jun 2026)

FII

0.02%

Held by 7 FIIs

DII

0.01%

Held by 0 DIIs

Promoter

57.00%

Why is Bodal Chemicals Ltd falling/rising?

06-Sep-2026

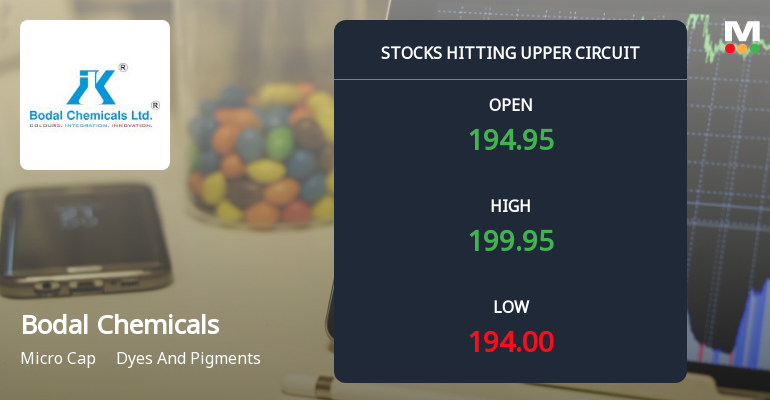
As of 05-Sep, Bodal Chemicals Ltd's stock price is at Rs 155.40, having risen 3.15% today and significantly outperforming the Sensex over various periods. The stock has shown a remarkable year-to-date increase of 190.14% and is close to its 52-week high, indicating strong upward momentum and increased investor interest.

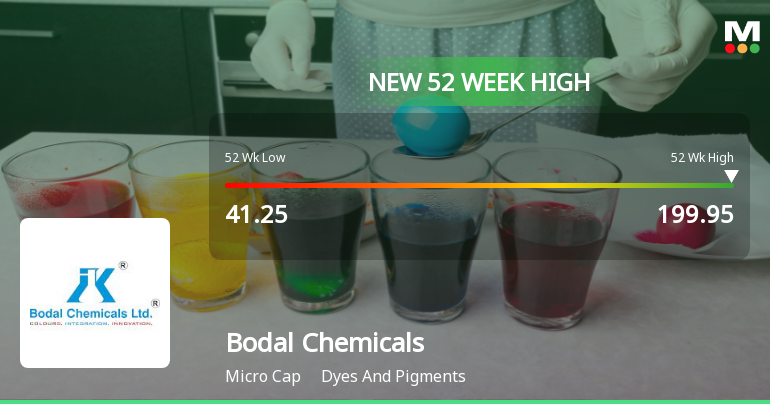
As of 05-Sep, Bodal Chemicals Ltd's stock price is rising, currently at Rs 155.40, reflecting an increase of Rs 4.75 or 3.15%. The stock has shown remarkable performance over various periods, with a 57.49% increase over the past week and a staggering 114.14% rise over the past month, significantly outperforming the Sensex, which has declined by 0.97% and 2.44% in the same periods, respectively. Year-to-date, the stock has surged by 190.14%, while the Sensex has decreased by 10.21%.<BR><BR>Today, the stock is close to its 52-week high, just 2.93% away from Rs 159.95, and has outperformed its sector by 3.84%. It has been on a consecutive gain streak for the last 13 days, achieving a remarkable 125.58% return during this period. The stock reached an intraday high of Rs 159.90, reflecting a 6.14% increase, although it also touched a low of Rs 146.10, which was a decrease of 3.02%.<BR><BR>Bodal Chemicals is trading above its 5-day, 20-day, 50-day, 100-day, and 200-day moving averages, indicating a strong upward trend. Additionally, there has been a notable increase in investor participation, with delivery volume rising by 63.96% against the 5-day average, suggesting heightened interest in the stock. The liquidity is also favorable, with a trading value sufficient for a trade size of Rs 3.52 crore. Overall, these factors contribute to the rising stock price of Bodal Chemicals Ltd.

View full answer

Who are in the management team of Bodal Chemicals?

01-Sep-2026

The management team of Bodal Chemicals includes Suresh J Patel (Chairman & Managing Director), Bhavin S Patel, Ankit S Patel, Rajarshi Ghosh (Executive Directors), Ashutosh B Bhatt (Company Secretary), and several Independent Directors: Nalin Kumar, Neha Huddar, Mayank Kulinchandra Mehta, and Rohit Maloo. They are responsible for the company's strategic direction and regulatory compliance.

The management team of Bodal Chemicals includes the following key individuals:<BR><BR>1. **Suresh J Patel** - Chairman & Managing Director<BR>2. **Bhavin S Patel** - Executive Director<BR>3. **Ankit S Patel** - Executive Director<BR>4. **Ashutosh B Bhatt** - Company Secretary & Compliance Officer<BR>5. **Rajarshi Ghosh** - Executive Director<BR>6. **Nalin Kumar** - Independent Director<BR>7. **Neha Huddar** - Independent Director<BR>8. **Mayank Kulinchandra Mehta** - Independent Director<BR>9. **Rohit Maloo** - Independent Director<BR><BR>This team plays a crucial role in guiding the company's strategic direction and ensuring compliance with regulatory standards.

View full answer

What does Bodal Chemicals do?

01-Sep-2026

Bodal Chemicals Ltd is a micro-cap manufacturer specializing in dyes and pigments, reporting net sales of 709 Cr and a net profit of 30 Cr for June 2026. The company has a market cap of INR 1,369 Cr and key financial metrics include a P/E ratio of 22.00 and a debt-equity ratio of 0.68.

Overview:<BR>Bodal Chemicals Ltd is a leading manufacturer in the dyes and pigments industry, categorized as a micro-cap company.<BR><BR>History:<BR>Bodal Chemicals Ltd was incorporated in an unspecified year and has established itself as a market leader in dyestuff and dye intermediates. The latest quarterly results reported net sales and profit for June 2026.<BR><BR>Financial Snapshot:<BR>- Net Sales: 709 Cr (Quarterly Results - Jun 2026)<BR>- Net Profit: 30 Cr (Quarterly Results - Jun 2026)<BR>- Market-cap value: INR 1,369 Cr (Micro Cap)<BR><BR>Key Metrics:<BR>- P/E: 22.00<BR>- Industry P/E: 18<BR>- Dividend Yield: 0.00%<BR>- Debt Equity: 0.68<BR>- Return on Equity: 4.13%<BR>- Price to Book: 1.07<BR><BR>Contact Details:<BR>- Address: P No 123 & 124 Phase I, GIDC Vatva Ahmedabad Gujarat : 382445<BR>- Tel: 91-079-2583 1684/2583 4223/25835437<BR>- Email: secretarial@bodal.com<BR>- Website: http://www.bodal.com

View full answer

Who are the peers of the Bodal Chemicals?

01-Sep-2026

Bodal Chemicals' peers include Sudarshan Chem, Kiri Industries, Sh.Pushkar Chem., Ultramarine Pig., and others. In terms of management risk, growth, and capital structure, Bodal Chemicals ranks below average compared to peers, with a 1-year return of 83.54%.

Peers: The peers of Bodal Chemicals are Sudarshan Chem, Kiri Industries, Sh.Pushkar Chem., Ultramarine Pig., Bhageria Indust., Sudarshan Colora, Asahi Songwon, AksharChem (I), and Poddar Pigments.<BR><BR>Quality Snapshot: Excellent management risk is observed at Sh.Pushkar Chem., Ultramarine Pig., Bhageria Indust., Sudarshan Colora, and Poddar Pigments, while Average management risk is found at Sudarshan Chem, Asahi Songwon, and the rest. Below Average management risk is noted for Kiri Industries, Bodal Chemicals, AksharChem (I). In terms of Growth, Excellent growth is seen at Ducol Organics, while Average growth is found at Sudarshan Chem, Ultramarine Pig., Bhageria Indust., Sudarshan Colora, and the rest. Below Average growth is noted for Kiri Industries, Sh.Pushkar Chem., Bodal Chemicals, Asahi Songwon, and AksharChem (I). For Capital Structure, Excellent capital structure is observed at Sh.Pushkar Chem., Ultramarine Pig., Bhageria Indust., Sudarshan Colora, and Poddar Pigments, while Average capital structure is found at Sudarshan Chem, and the rest. Below Average capital structure is noted for Kiri Industries, Bodal Chemicals, Asahi Songwon, and AksharChem (I).<BR><BR>Return Snapshot: The peer with the highest 1-year return is Sh.Pushkar Chem. at 49.94%, while the lowest is Sudarshan Chem. at -15.32%. Bodal Chemicals has a 1-year return of 83.54%, which is significantly higher than Sudarshan Chem. Additionally, Sudarshan Colora has a negative six-month return of -4.27% and Ultramarine Pig. has a negative six-month return of 2.73%.

View full answer

How big is Bodal Chemicals?

01-Sep-2026

As of 31st August, Bodal Chemicals Ltd has a market capitalization of 1,369.00 Cr, with recent net sales of 2,267.08 Cr and a net profit of 68.67 Cr. The latest balance sheet shows shareholder's funds of 1,104.85 Cr and total assets of 2,339.32 Cr.

As of 31st August, Bodal Chemicals Ltd has a market capitalization of 1,369.00 Cr, categorizing it as a Micro Cap company.<BR><BR>In the latest four quarters, Bodal Chemicals reported Net Sales of 2,267.08 Cr and a Net Profit of 68.67 Cr.<BR><BR>The latest annual period for the balance sheet is March 2025, showing Shareholder's Funds of 1,104.85 Cr and Total Assets of 2,339.32 Cr.

View full answer

Should I buy, sell or hold Bodal Chemicals Ltd?

06-Aug-2026

When is the next results date for Bodal Chemicals Ltd?

28-Jul-2026

The next results date for Bodal Chemicals Ltd is 05 August 2026.

The next results date for Bodal Chemicals Ltd is scheduled for 05 August 2026.

View full answer

Are Bodal Chemicals Ltd latest results good or bad?

22-May-2026

Bodal Chemicals Ltd's latest results show strong revenue growth of 30.42% and a 121.10% increase in net profit, indicating positive momentum. However, concerns about weak return on equity and high debt levels suggest that investors should remain cautious despite the encouraging performance.

Bodal Chemicals Ltd's latest results present a mixed picture. On one hand, the company reported strong revenue growth of 30.42% year-on-year, reaching ₹588.02 crores for the March 2026 quarter. This growth was accompanied by a significant improvement in net profit, which surged by 121.10% year-on-year to ₹32.06 crores, marking a remarkable recovery from previous quarters.<BR><BR>The operating margin also improved to 11.66%, reflecting better cost management and operational efficiency. This quarter is noted as one of the strongest in recent memory, indicating positive momentum in the company's performance.<BR><BR>However, despite these encouraging results, Bodal Chemicals faces several structural challenges. The return on equity (ROE) remains weak at just 3.24%, and the company carries high leverage with a debt-to-EBITDA ratio of 5.49 times. These factors raise concerns about the sustainability of its financial performance and overall investment appeal.<BR><BR>In summary, while the latest results show strong growth and recovery in profitability, the underlying issues related to capital efficiency and high debt levels suggest that investors should approach with caution. The outlook is cautiously optimistic, but significant risks remain.

View full answer

Is Bodal Chemicals overvalued or undervalued?

14-Nov-2025

As of November 13, 2025, Bodal Chemicals is considered an attractive investment due to its undervalued status, with a PE ratio of 20.27, an EV to EBITDA of 9.69, and a Price to Book Value of 0.66, making it significantly cheaper than peers like Sudarshan Chemicals and Kiri Industries, despite a year-to-date return of -13.54%.

As of 13 November 2025, the valuation grade for Bodal Chemicals has moved from very attractive to attractive. The company is currently assessed as undervalued. Key ratios include a PE ratio of 20.27, an EV to EBITDA of 9.69, and a Price to Book Value of 0.66, which suggest that the stock is trading at a reasonable valuation compared to its earnings and assets.<BR><BR>In comparison to its peers, Bodal Chemicals has a PE ratio of 20.27, while Sudarshan Chemicals is at 138.83 and Kiri Industries at 25.78, indicating that Bodal is significantly cheaper relative to these competitors. Furthermore, the PEG ratio of 0.01 highlights its growth potential compared to the price. Despite recent underperformance with a year-to-date return of -13.54% against the Sensex's 8.11%, the valuation metrics suggest that Bodal Chemicals remains an attractive investment opportunity in the dyes and pigments industry.

View full answer

How has been the historical performance of Bodal Chemicals?

13-Nov-2025

Bodal Chemicals has shown fluctuating historical performance, with net sales increasing to 1,744.94 Cr in March 2025 from 1,394.62 Cr in March 2024, but still lower than 2,050.62 Cr in March 2022. While profits improved, cash flow declined, indicating mixed results overall.

Answer:<BR>The historical performance of Bodal Chemicals shows a fluctuating trend in key financial metrics over the years.<BR><BR>Breakdown:<BR>Bodal Chemicals reported net sales of 1,744.94 Cr in March 2025, an increase from 1,394.62 Cr in March 2024, but a decline from 2,050.62 Cr in March 2022. Total operating income followed a similar pattern, reaching 1,744.94 Cr in March 2025 compared to 1,394.62 Cr in the previous year. The company's total expenditure, excluding depreciation, was 1,586.08 Cr in March 2025, up from 1,299.95 Cr in March 2024. Operating profit (PBDIT) increased to 170.65 Cr in March 2025 from 119.47 Cr in March 2024, although it was significantly lower than the 236.93 Cr reported in March 2022. Profit before tax also rose to 19.31 Cr in March 2025 from 4.73 Cr in March 2024, while profit after tax increased to 18.50 Cr from 6.47 Cr in the same period. The total assets of the company grew to 2,339.32 Cr in March 2025, compared to 2,280.55 Cr in March 2024, with total liabilities also increasing to 2,339.32 Cr from 2,280.55 Cr. Cash flow from operating activities was 113.00 Cr in March 2025, down from 204.00 Cr in March 2024, indicating a decline in cash generation efficiency. Overall, Bodal Chemicals has experienced a mixed performance with some recovery in sales and profits, but challenges remain evident in cash flow and overall profitability compared to earlier years.

View full answer

Is Bodal Chemicals technically bullish or bearish?

07-Oct-2025

As of October 6, 2025, Bodal Chemicals has shifted to a bearish technical stance, supported by bearish MACD, Bollinger Bands, and moving averages, despite a conflicting bullish RSI on the weekly chart.

As of 6 October 2025, the technical trend has changed from mildly bearish to bearish. The current technical stance for Bodal Chemicals is bearish with moderate strength. Key indicators driving this stance include a bearish MACD on the weekly chart, bearish signals from Bollinger Bands and KST on both weekly and monthly time frames, and bearish moving averages on the daily chart. The RSI shows a bullish signal on the weekly but lacks confirmation from the monthly perspective. Overall, the combination of these indicators suggests a prevailing bearish sentiment in the market.

View full answer

Who are the top shareholders of the Bodal Chemicals?

06-Jun-2025

The top shareholder of Bodal Chemicals is Sureshbhai Jayantibhai Patel, holding 29.47%, with individual investors collectively owning 36.16%. There are no pledged promoter holdings, and the company has 17 foreign institutional investors holding a total of 0.32%, with no mutual funds involved.

The top shareholders of Bodal Chemicals primarily include the promoters, with Sureshbhai Jayantibhai Patel holding the largest share at 29.47%. There are no pledged promoter holdings reported. In terms of public shareholders, Ashokkumar Giriraj Bansal is the highest with a holding of 1.74%. Additionally, individual investors collectively hold 36.16% of the shares. The company also has 17 foreign institutional investors (FIIs) that hold a combined 0.32%. There are currently no mutual funds holding shares in Bodal Chemicals.

View full answer

Has Bodal Chemicals declared dividend?

06-Jun-2025

Bodal Chemicals Ltd has declared a 5% dividend, with an ex-date of September 22, 2023. Despite the dividend declaration, the dividend yield is 0%, and total returns have varied significantly across different periods.

Bodal Chemicals Ltd has declared a 5% dividend.<BR><BR>Dividend Details:<BR>- Percentage announced: 5%<BR>- Ex-date: 22 Sep 23<BR><BR>Dividend Yield: 0%<BR><BR>Total Returns by Period:<BR>In the last 6 months, the price return was -3.93%, with a dividend return of 0%, resulting in a total return of -3.93%.<BR><BR>Over the past year, the price return was 2.19%, with a dividend return of 0%, leading to a total return of 2.19%.<BR><BR>In the 2-year period, the price return was 8.2%, with a dividend return of 0.13%, resulting in a total return of 8.33%.<BR><BR>For the 3-year period, the price return was -26.06%, with a dividend return of 1.13%, leading to a total return of -24.93%.<BR><BR>In the last 4 years, the price return was -28.77%, with a dividend return of 1.69%, resulting in a total return of -27.08%.<BR><BR>Over the past 5 years, the price return was 29.66%, with a dividend return of 2.78%, leading to a total return of 32.44%.<BR><BR>Overall, Bodal Chemicals has declared a dividend, but the dividend yield remains at 0%. The total returns over various periods show a mixed performance, with significant fluctuations in returns, particularly in the 3 and 4-year periods, while the 5-year period shows a positive total return.

View full answer
iScoreScore
Click here to find our call on this stock
Strong Sell
Sell
Hold
Buy
Strong Buy

Dashboard

1

Weak Long Term Fundamental Strength with a -1.80% CAGR growth in Operating Profits over the last 5 years

  • Low ability to service debt as the company has a high Debt to EBITDA ratio of 5.04 times
  • The company has been able to generate a Return on Equity (avg) of 4.10% signifying low profitability per unit of shareholders funds
2

With a growth in Net Sales of 20.58%, the company declared Very Positive results in Jun 26

3

With ROCE of 4.7, it has a Fair valuation with a 1.7 Enterprise value to Capital Employed

4

Despite the size of the company, domestic mutual funds hold only 0% of the company

stock-summaryMojo Parameters

Mojo Parameters

Loading Valuation Snapshot...

Stock DNA

stock-summary
Industry

Dyes And Pigments

stock-summary
Market cap

INR 2,510 Cr (Micro Cap)

stock-summary
P/E

36.00

stock-summary
Industry P/E

19

stock-summary
Dividend Yield

0.00%

stock-summary
Debt Equity

0.68

stock-summary
Return on Equity

4.13%

stock-summary
Price to Book

2.07

Revenue and Profits:
Net Sales:
709 Cr
(Quarterly Results - Jun 2026)
Net Profit:
30 Cr
stock-summaryTotal Returns
Total Returns (Price + Dividend) stock-summary
Dividend Yield (0%)
TimePeriod
Price Return
Dividend Return
Total Return
3 Months
179.84%
0%
179.84%
6 Months
261.77%
0%
261.77%
1 Year
198.79%
0%
198.79%
2 Years
145.33%
0%
145.33%
3 Years
153.31%
0%
153.31%
4 Years
117.26%
0.12%
117.38%
5 Years
84.34%
0.64%
84.98%

Latest dividend: 0.1 per share ex-dividend date: Sep-22-2023

Risk Adjusted Returns v/s stock-summary
Returns Beta
Icon
Beta has not been calculated since enough price history is not available
stock-summaryNews & Corporate Actions

Announcements stock-summary

Bodal Chemicals Limited - Other General Purpose

28-Nov-2019 | Source : NSE

Bodal Chemicals Limited has informed the Exchange regarding Disclosure of Related Party Transactions for the half year ended September 30, 2019.

Bodal Chemicals Limited - Analysts/Institutional Investor Meet/Con. Call Updates

22-Nov-2019 | Source : NSE

Bodal Chemicals Limited has informed the Exchange regarding Analysts/Institutional Investor Meet/Con. Call Updates

Bodal Chemicals Limited - Updates

18-Nov-2019 | Source : NSE

Bodal Chemicals Limited has informed the Exchange regarding 'Copies of Un-Audited Standalone and Consolidated Financial Results for Quarter and Half year ended 30th September, 2019'.

Corporate Actions stock-summary

stock-summary
BOARD MEETING

No Upcoming Board Meetings

stock-summary
DIVIDEND

Bodal Chemicals Ltd has declared 5% dividend, ex-date: 22 Sep 23

stock-summary
SPLITS

Bodal Chemicals Ltd has announced 2:10 stock split, ex-date: 10 Jun 10

stock-summary
BONUS

No Bonus history available

stock-summary
RIGHTS

Bodal Chemicals Ltd has announced 1:2 rights issue, ex-date: 04 Mar 08

stock-summaryKey Factors

Quality key factors stock-summary

Factor
Value
Sales Growth (5y)
8.18%
EBIT Growth (5y)
-1.80%
EBIT to Interest (avg)
1.95
Debt to EBITDA (avg)
5.81
Net Debt to Equity (avg)
0.68
Sales to Capital Employed (avg)
0.93
Tax Ratio
15.19%
Dividend Payout Ratio
0
Pledged Shares
0
Institutional Holding
0.03%
ROCE (avg)
4.85%
ROE (avg)
4.10%

Valuation key factors

Factor
Value
P/E Ratio
36
Industry P/E
19
Price to Book Value
2.15
EV to EBIT
28.99
EV to EBITDA
17.95
EV to Capital Employed
1.68
EV to Sales
1.45
PEG Ratio
0.28
Dividend Yield
NA
ROCE (Latest)
4.70%
ROE (Latest)
4.13%

Technicals key factors

Indicator
Weekly
Monthly
MACD
Bullish
Bullish
RSI
Bearish
Bearish
Bollinger Bands
Bullish
Bullish
Moving Averages
Bullish (Daily)
KST
Bullish
Bullish
Dow Theory
Bullish
Bullish
OBV
No Trend
Bullish
stock-summary Technical Indicator Scale: Bearish, Mildly Bearish, Sideways, Mildly Bullish, Bullish  Turned 
stock-summaryShareholding
Shareholding Snapshot : Jun 2026stock-summary
Shareholding Compare (%holding) stock-summary
Majority shareholders

Promoters

Pledged Promoter Holdings

None

Mutual Funds

Held by 0 Schemes

FIIs

Held by 7 FIIs (0.02%)

Promoter with highest holding

Sureshbhai Jayantibhai Patel (29.47%)

Highest Public shareholder

Ashokkumar Giriraj Bansal (4.23%)

Individual Investors Holdings

36.15%

stock-summaryFinancial
[
  {
    "link": "quarterly",
    "btn_text": "All Quarterly Results",
    "header": "Quarterly Results Snapshot (Consolidated) - Jun'26 - QoQ",
    "rhs": [
      {
        "prefix": "Net Sales ",
        "suffix": "QoQ Growth in quarter ended Jun 2026 is 20.58% vs 20.11% in Mar 2026",
        "dir": 1
      },
      {
        "prefix": "Consolidated Net Profit ",
        "suffix": "QoQ Growth in quarter ended Jun 2026 is -5.24% vs 13,258.33% in Mar 2026",
        "dir": -1
      }
    ],
    "table": {
      "header": [
        "Jun'26",
        "Mar'26",
        "Change(%)"
      ],
      "body": [
        {
          "field": "Net Sales",
          "val1": "709.04",
          "val2": "588.02",
          "chgp": "20.58%",
          "chgp_class": "positive"
        },
        {
          "field": "Operating Profit (PBDIT) excl Other Income",
          "val1": "68.94",
          "val2": "68.56",
          "chgp": "0.55%",
          "chgp_class": "positive"
        },
        {
          "field": "Interest",
          "val1": "18.57",
          "val2": "17.83",
          "chgp": "4.15%",
          "chgp_class": "negative"
        },
        {
          "field": "Exceptional Items",
          "val1": "0.00",
          "val2": "0.00",
          "chgp": "",
          "chgp_class": "neutral"
        },
        {
          "field": "Consolidate Net Profit",
          "val1": "30.38",
          "val2": "32.06",
          "chgp": "-5.24%",
          "chgp_class": "negative"
        },
        {
          "field": "Operating Profit Margin (Excl OI)",
          "val1": "9.72%",
          "val2": "11.66%",
          "chgp": "-1.94%",
          "chgp_class": "negative"
        }
      ]
    }
  },
  {
    "link": "half-yearly",
    "btn_text": "All Half Yearly Results",
    "header": "Half Yearly Results Snapshot (Consolidated) - Sep'25",
    "rhs": [
      {
        "prefix": "Net Sales ",
        "suffix": " Growth in half year ended Sep 2025 is 9.88% vs 28.40% in Sep 2024",
        "dir": -1
      },
      {
        "prefix": "Consolidated Net Profit ",
        "suffix": " Growth in half year ended Sep 2025 is 1,193.66% vs -141.16% in Sep 2024",
        "dir": 1
      }
    ],
    "table": {
      "header": [
        "Sep'25",
        "Sep'24",
        "Change(%)"
      ],
      "body": [
        {
          "field": "Net Sales",
          "val1": "934.66",
          "val2": "850.60",
          "chgp": "9.88%",
          "chgp_class": "positive"
        },
        {
          "field": "Operating Profit (PBDIT) excl Other Income",
          "val1": "70.60",
          "val2": "67.12",
          "chgp": "5.18%",
          "chgp_class": "positive"
        },
        {
          "field": "Interest",
          "val1": "41.55",
          "val2": "40.87",
          "chgp": "1.66%",
          "chgp_class": "negative"
        },
        {
          "field": "Exceptional Items",
          "val1": "-0.03",
          "val2": "0.00",
          "chgp": "",
          "chgp_class": "neutral"
        },
        {
          "field": "Consolidate Net Profit",
          "val1": "15.53",
          "val2": "-1.42",
          "chgp": "1,193.66%",
          "chgp_class": "positive"
        },
        {
          "field": "Operating Profit Margin (Excl OI)",
          "val1": "7.55%",
          "val2": "7.89%",
          "chgp": "-0.34%",
          "chgp_class": "negative"
        }
      ]
    }
  },
  {
    "link": "nine-monthly",
    "btn_text": "All Nine Monthly Results",
    "header": "Nine Monthly Results Snapshot (Consolidated) - Dec'25",
    "rhs": [
      {
        "prefix": "Net Sales ",
        "suffix": "YoY Growth in nine months ended Dec 2025 is 10.06% vs 29.27% in Dec 2024",
        "dir": -1
      },
      {
        "prefix": "Consolidated Net Profit ",
        "suffix": "YoY Growth in nine months ended Dec 2025 is 294.25% vs -9.71% in Dec 2024",
        "dir": 1
      }
    ],
    "table": {
      "header": [
        "Dec'25",
        "Dec'24",
        "Change(%)"
      ],
      "body": [
        {
          "field": "Net Sales",
          "val1": "1,424.23",
          "val2": "1,294.07",
          "chgp": "10.06%",
          "chgp_class": "positive"
        },
        {
          "field": "Operating Profit (PBDIT) excl Other Income",
          "val1": "92.65",
          "val2": "111.62",
          "chgp": "-17.00%",
          "chgp_class": "negative"
        },
        {
          "field": "Interest",
          "val1": "60.99",
          "val2": "60.58",
          "chgp": "0.68%",
          "chgp_class": "negative"
        },
        {
          "field": "Exceptional Items",
          "val1": "-0.03",
          "val2": "-1.25",
          "chgp": "97.60%",
          "chgp_class": "positive"
        },
        {
          "field": "Consolidate Net Profit",
          "val1": "15.77",
          "val2": "4.00",
          "chgp": "294.25%",
          "chgp_class": "positive"
        },
        {
          "field": "Operating Profit Margin (Excl OI)",
          "val1": "6.51%",
          "val2": "8.63%",
          "chgp": "-2.12%",
          "chgp_class": "negative"
        }
      ]
    }
  },
  {
    "link": "annual",
    "btn_text": "All Annual Results",
    "header": "Annual Results Snapshot (Consolidated) - Mar'26",
    "rhs": [
      {
        "prefix": "Net Sales ",
        "suffix": "YoY Growth in year ended Mar 2026 is 15.09% vs 25.37% in Mar 2025",
        "dir": -1
      },
      {
        "prefix": "Consolidated Net Profit ",
        "suffix": "YoY Growth in year ended Mar 2026 is 158.54% vs 185.94% in Mar 2025",
        "dir": -1
      }
    ],
    "table": {
      "header": [
        "Mar'26",
        "Mar'25",
        "Change(%)"
      ],
      "body": [
        {
          "field": "Net Sales",
          "val1": "2,012.24",
          "val2": "1,748.43",
          "chgp": "15.09%",
          "chgp_class": "positive"
        },
        {
          "field": "Operating Profit (PBDIT) excl Other Income",
          "val1": "161.20",
          "val2": "162.35",
          "chgp": "-0.71%",
          "chgp_class": "negative"
        },
        {
          "field": "Interest",
          "val1": "78.82",
          "val2": "81.58",
          "chgp": "-3.38%",
          "chgp_class": "positive"
        },
        {
          "field": "Exceptional Items",
          "val1": "-0.03",
          "val2": "-1.25",
          "chgp": "97.60%",
          "chgp_class": "positive"
        },
        {
          "field": "Consolidate Net Profit",
          "val1": "47.83",
          "val2": "18.50",
          "chgp": "158.54%",
          "chgp_class": "positive"
        },
        {
          "field": "Operating Profit Margin (Excl OI)",
          "val1": "8.01%",
          "val2": "9.29%",
          "chgp": "-1.28%",
          "chgp_class": "negative"
        }
      ]
    }
  }
]

Quarterly Results Snapshot (Consolidated) - Jun'26 - QoQstock-summary

Jun'26
Mar'26
Change(%)
Net Sales
709.04
588.02
20.58%
Operating Profit (PBDIT) excl Other Income
68.94
68.56
0.55%
Interest
18.57
17.83
4.15%
Exceptional Items
0.00
0.00
Consolidate Net Profit
30.38
32.06
-5.24%
Operating Profit Margin (Excl OI)
9.72%
11.66%
-1.94%
Values in Rs Cr.
Direction Arrows
Net Sales

QoQ Growth in quarter ended Jun 2026 is 20.58% vs 20.11% in Mar 2026

Direction Arrows
Consolidated Net Profit

QoQ Growth in quarter ended Jun 2026 is -5.24% vs 13,258.33% in Mar 2026

Half Yearly Results Snapshot (Consolidated) - Sep'25stock-summary

Sep'25
Sep'24
Change(%)
Net Sales
934.66
850.60
9.88%
Operating Profit (PBDIT) excl Other Income
70.60
67.12
5.18%
Interest
41.55
40.87
1.66%
Exceptional Items
-0.03
0.00
Consolidate Net Profit
15.53
-1.42
1,193.66%
Operating Profit Margin (Excl OI)
7.55%
7.89%
-0.34%
Values in Rs Cr.
Direction Arrows
Net Sales

Growth in half year ended Sep 2025 is 9.88% vs 28.40% in Sep 2024

Direction Arrows
Consolidated Net Profit

Growth in half year ended Sep 2025 is 1,193.66% vs -141.16% in Sep 2024

Nine Monthly Results Snapshot (Consolidated) - Dec'25stock-summary

Dec'25
Dec'24
Change(%)
Net Sales
1,424.23
1,294.07
10.06%
Operating Profit (PBDIT) excl Other Income
92.65
111.62
-17.00%
Interest
60.99
60.58
0.68%
Exceptional Items
-0.03
-1.25
97.60%
Consolidate Net Profit
15.77
4.00
294.25%
Operating Profit Margin (Excl OI)
6.51%
8.63%
-2.12%
Values in Rs Cr.
Direction Arrows
Net Sales

YoY Growth in nine months ended Dec 2025 is 10.06% vs 29.27% in Dec 2024

Direction Arrows
Consolidated Net Profit

YoY Growth in nine months ended Dec 2025 is 294.25% vs -9.71% in Dec 2024

Annual Results Snapshot (Consolidated) - Mar'26stock-summary

Mar'26
Mar'25
Change(%)
Net Sales
2,012.24
1,748.43
15.09%
Operating Profit (PBDIT) excl Other Income
161.20
162.35
-0.71%
Interest
78.82
81.58
-3.38%
Exceptional Items
-0.03
-1.25
97.60%
Consolidate Net Profit
47.83
18.50
158.54%
Operating Profit Margin (Excl OI)
8.01%
9.29%
-1.28%
Values in Rs Cr.
Direction Arrows
Net Sales

YoY Growth in year ended Mar 2026 is 15.09% vs 25.37% in Mar 2025

Direction Arrows
Consolidated Net Profit

YoY Growth in year ended Mar 2026 is 158.54% vs 185.94% in Mar 2025

stock-summaryCompany CV
About Bodal Chemicals Ltd stock-summary
stock-summary
Bodal Chemicals Ltd
Micro Cap
Dyes And Pigments
Bodal Chemicals Limited, one of the market leader of dyestuff and dye intermediates in the world is an innovative company. At present, the Company has 9 manufacturing units in Gujarat, 4 in Ahmedabad, 3 in Vadodara and 2 in Ankleshwar where products for textiles, paper, plastic, leather and many other specialty chemicals are produced. The Company is engaged in manufacturing of Dyes, Dyes Intermediates and Basic Chemicals.
Company Coordinates stock-summary
Company Details
P No 123 & 124 Phase I, GIDC Vatva Ahmedabad Gujarat : 382445
stock-summary
Tel: 91-079-2583 1684/2583 4223/25835437
stock-summary
secretarial@bodal.com
Registrar Details