
Compare Bhageria Indust. with Similar Stocks
Dashboard
Company has a Debt to Equity ratio (avg) of 0.03 times
Poor long term growth as Operating profit has grown by an annual rate -5.49% of over the last 5 years
The company has declared Positive results for the last 10 consecutive quarters
With ROCE of 8.8, it has a Fair valuation with a 1.5 Enterprise value to Capital Employed
Despite the size of the company, domestic mutual funds hold only 0% of the company
Market Beating performance in long term as well as near term
Stock DNA
Dyes And Pigments
INR 912 Cr (Micro Cap)
20.00
20
0.73%
0.12
7.72%
1.51
Total Returns (Price + Dividend) 
Latest dividend: 1.5 per share ex-dividend date: Jul-25-2025
Risk Adjusted Returns v/s
Returns Beta

News

Bhageria Industries Ltd is Rated Hold by MarketsMOJO
Bhageria Industries Ltd is rated 'Hold' by MarketsMOJO, with this rating last updated on 25 May 2026. However, the analysis and financial metrics presented here reflect the company’s current position as of 09 June 2026, providing investors with an up-to-date view of its fundamentals, returns, and market standing.
Read full news article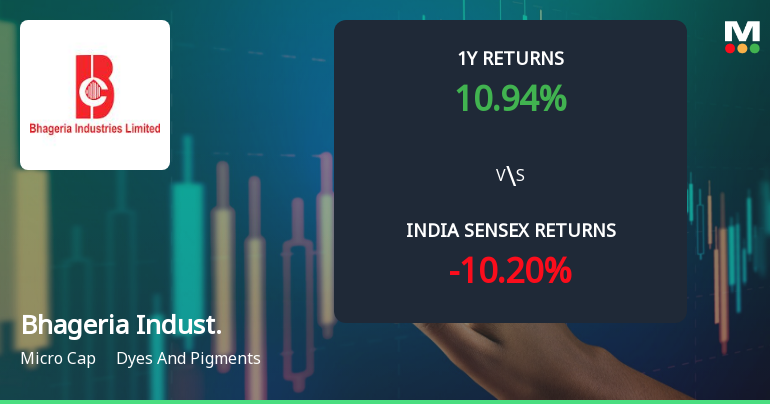
Bhageria Industries Ltd Sees Technical Momentum Shift Amid Strong Price Rally
Bhageria Industries Ltd, a micro-cap player in the dyes and pigments sector, has witnessed a notable shift in its technical momentum following a sharp price surge of nearly 20% in a single trading session. This development has prompted a reassessment of the stock’s outlook, with technical indicators signalling a transition from a mildly bearish stance to a more neutral, sideways trend. Investors and analysts are now closely monitoring key momentum oscillators and moving averages to gauge the sustainability of this rally.
Read full news article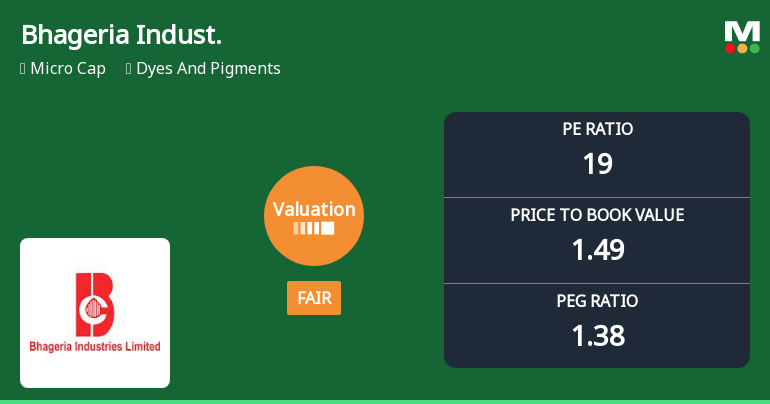
Bhageria Industries Ltd Valuation Shifts Signal Changing Market Sentiment
Bhageria Industries Ltd, a micro-cap player in the Dyes and Pigments sector, has witnessed a notable shift in its valuation parameters, moving from very attractive to fair territory. This change comes alongside a robust price rally that has significantly outperformed the broader market indices, prompting a reassessment of its price-to-earnings and price-to-book ratios relative to historical and peer benchmarks.
Read full news article Announcements
Announcement Under Regulation 30 (LODR) 2015-Update
10-Jun-2026 | Source : BSEAnnouncement Under Regulation 30 (LODR) 2015: Update regarding Intimation to Shareholder for transfer of Share to IEPF in Newspaper.
Announcement Under Regulation 330 (LODR) 2015
09-Jun-2026 | Source : BSEClarification on price movement
Clarification sought from Bhageria Industries Ltd
08-Jun-2026 | Source : BSEThe Exchange has sought clarification from Bhageria Industries Ltd on June 08 2026 with reference to significant movement in price in order to ensure that investors have latest relevant information about the company and to inform the market so that the interest of the investors is safeguarded.
The reply is awaited.
Corporate Actions

No Upcoming Board Meetings

Bhageria Industries Ltd has declared 30% dividend, ex-date: 25 Jul 25

Bhageria Industries Ltd has announced 5:10 stock split, ex-date: 26 Oct 16

Bhageria Industries Ltd has announced 1:1 bonus issue, ex-date: 17 Jul 19

No Rights history available
Quality key factors
Valuation key factors
Technicals key factors
 Technical Indicator Scale: Bearish, Mildly Bearish, Sideways, Mildly Bullish, Bullish Turned
 Shareholding Snapshot : Mar 2026
Shareholding Compare (%holding)
Promoters
None
Held by 0 Schemes
Held by 4 FIIs (0.44%)
Bhageria Trade Invest Pvt Ltd (15.16%)
None
14.51%
Quarterly Results Snapshot (Consolidated) - Mar'26 - QoQ

QoQ Growth in quarter ended Mar 2026 is 12.01% vs 18.18% in Dec 2025

QoQ Growth in quarter ended Mar 2026 is 5.72% vs -5.09% in Dec 2025
Half Yearly Results Snapshot (Consolidated) - Sep'25
Growth in half year ended Sep 2025 is 49.76% vs 20.78% in Sep 2024
Growth in half year ended Sep 2025 is 84.48% vs 210.95% in Sep 2024
Nine Monthly Results Snapshot (Consolidated) - Dec'25
YoY Growth in nine months ended Dec 2025 is 46.47% vs 32.03% in Dec 2024
YoY Growth in nine months ended Dec 2025 is 38.95% vs 100.73% in Dec 2024
Annual Results Snapshot (Consolidated) - Mar'26
YoY Growth in year ended Mar 2026 is 46.98% vs 20.29% in Mar 2025
YoY Growth in year ended Mar 2026 is 14.06% vs 111.85% in Mar 2025
About Bhageria Industries Ltd

Company Coordinates


