
Compare Bodal Chemicals with Similar Stocks
Dashboard
Weak Long Term Fundamental Strength with an average Return on Capital Employed (ROCE) of 5.29%
- Poor long term growth as Net Sales has grown by an annual rate of 10.41% and Operating profit at 10.21% over the last 5 years
- Low ability to service debt as the company has a high Debt to EBITDA ratio of 5.04 times
With a growth in Net Profit of 13258.33%, the company declared Very Positive results in Mar 26
With ROCE of 4.7, it has a Attractive valuation with a 0.8 Enterprise value to Capital Employed
Despite the size of the company, domestic mutual funds hold only 0% of the company
Stock DNA
Dyes And Pigments
INR 838 Cr (Micro Cap)
18.00
20
0.00%
0.68
4.13%
0.72
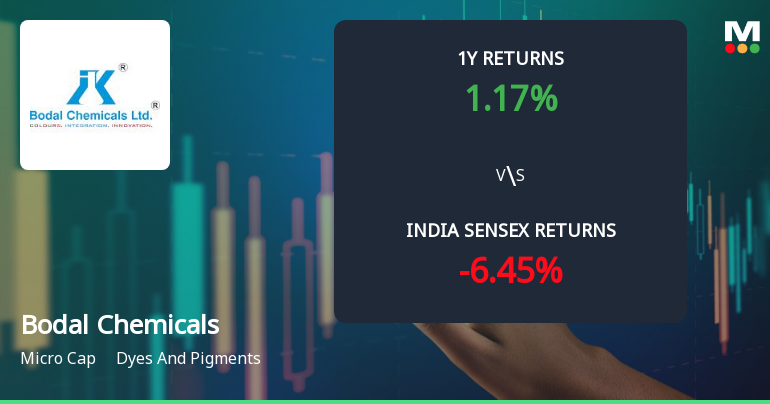
Total Returns (Price + Dividend) 
Latest dividend: 0.10002545176889793 per share ex-dividend date: Sep-22-2023
Risk Adjusted Returns v/s
Returns Beta

News
Bodal Chemicals Ltd Technical Momentum Shifts Amid Mixed Market Returns
Bodal Chemicals Ltd, a micro-cap player in the Dyes and Pigments sector, has experienced a nuanced shift in its technical momentum, moving from a bullish to a mildly bullish stance. Despite a recent day decline of 1.91%, the stock’s year-to-date return of 28.73% notably outpaces the Sensex’s negative 9.54% over the same period, signalling underlying strength amid broader market volatility.
Read full news article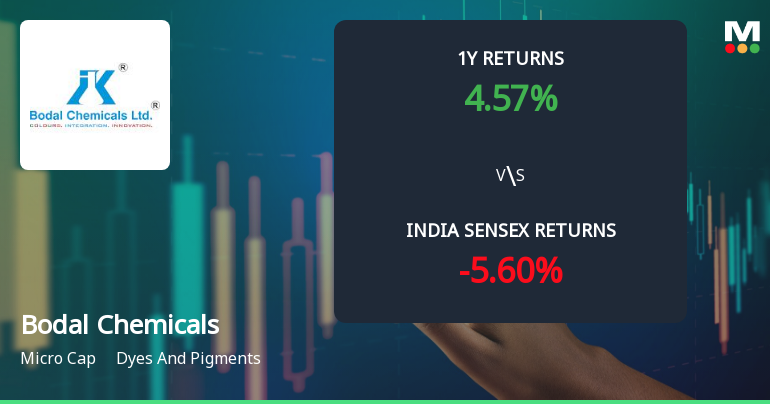
Bodal Chemicals Ltd Technical Momentum Shifts Signal Bullish Outlook
Bodal Chemicals Ltd has demonstrated a notable shift in its technical momentum, moving from a mildly bullish stance to a more confident bullish trend. This change is underpinned by improvements across key technical indicators including MACD, moving averages, and Bollinger Bands, signalling renewed investor interest and potential upside in the dyes and pigments sector.
Read full news article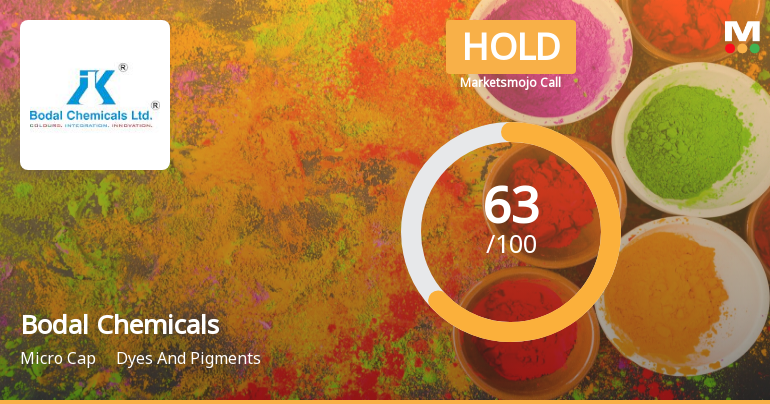
Bodal Chemicals Ltd is Rated Hold
Bodal Chemicals Ltd is rated 'Hold' by MarketsMOJO, with this rating last updated on 18 May 2026. While the rating change occurred on that date, the analysis and financial metrics presented here reflect the stock’s current position as of 21 June 2026, providing investors with the most up-to-date perspective on the company’s fundamentals, valuation, financial trends, and technical outlook.
Read full news article Announcements
Announcement under Regulation 30 (LODR)-Newspaper Publication
05-Jun-2026 | Source : BSEBodal Chemicals Limited herewith submit news paper publication for IEPF advertisement notice.
Announcement under Regulation 30 (LODR)-Newspaper Publication
22-May-2026 | Source : BSEBodal Chemicals Limited herewith submit newspaper publication
Result - Audited Financial Results For Quarter And Year Ended 31St March 2026
21-May-2026 | Source : BSEBodal Chemicals Limited herewith submit Consolidated and Standalone Audited financial Results for quarter and year ended 31st March 2026
Corporate Actions

No Upcoming Board Meetings

Bodal Chemicals Ltd has declared 5% dividend, ex-date: 22 Sep 23

Bodal Chemicals Ltd has announced 2:10 stock split, ex-date: 10 Jun 10

No Bonus history available

Bodal Chemicals Ltd has announced 1:2 rights issue, ex-date: 04 Mar 08
Quality key factors
Valuation key factors
Technicals key factors
 Technical Indicator Scale: Bearish, Mildly Bearish, Sideways, Mildly Bullish, Bullish Turned
 Shareholding Snapshot : Mar 2026
Shareholding Compare (%holding)
Promoters
None
Held by 0 Schemes
Held by 5 FIIs (0.15%)
Sureshbhai Jayantibhai Patel (29.47%)
Ashokkumar Giriraj Bansal (3.19%)
36.14%
Quarterly Results Snapshot (Consolidated) - Mar'26 - QoQ

QoQ Growth in quarter ended Mar 2026 is 20.11% vs 1.90% in Dec 2025
QoQ Growth in quarter ended Mar 2026 is 13,258.33% vs -95.99% in Dec 2025
Half Yearly Results Snapshot (Consolidated) - Sep'25

Growth in half year ended Sep 2025 is 9.88% vs 28.40% in Sep 2024
Growth in half year ended Sep 2025 is 1,193.66% vs -141.16% in Sep 2024
Nine Monthly Results Snapshot (Consolidated) - Dec'25
YoY Growth in nine months ended Dec 2025 is 10.06% vs 29.27% in Dec 2024
YoY Growth in nine months ended Dec 2025 is 294.25% vs -9.71% in Dec 2024
Annual Results Snapshot (Consolidated) - Mar'26
YoY Growth in year ended Mar 2026 is 15.09% vs 25.37% in Mar 2025
YoY Growth in year ended Mar 2026 is 158.54% vs 185.94% in Mar 2025
About Bodal Chemicals Ltd

Company Coordinates


