Bhandari Hosiery

  • Market Cap: Micro Cap
  • Industry: Garments & Apparels
  • ISIN: INE474E01029
  • NSEID: BHANDARI
  • BSEID: 512608
INR
3.04
-0.02 (-0.65%)
BSENSE

Aug 25, 03:58 PM

BSE+NSE Vol: 68.75 k

  • Price Points
  • Score
  • Mojo Parameters
  • Total Return
  • News and Corporate Actions
  • Key factors
  • Shareholding
  • Financials
  • CompanyCV
stock-summaryPrice Point
High/Low

1Day

52 Week

Valuation
Technical
Day's Volume

CASH

68.75 k (-68.10%) Volume

Shareholding (Jun 2026)

FII

0.00%

Held by 0 FIIs

DII

0.00%

Held by 0 DIIs

Promoter

41.83%

Why is Bhandari Hosiery Exports Ltd falling/rising?

25-Aug-2026

As of 24-Aug, Bhandari Hosiery Exports Ltd's stock price is stable at 3.05, with a slight decline of 0.33% over the past week. Despite recent stability, the stock has experienced significant long-term declines, including a 31.92% drop over the past year.

As of 24-Aug, Bhandari Hosiery Exports Ltd's stock price is currently stable at 3.05, showing no change (0.00%). Over the past week, the stock has experienced a slight decline of 0.33%, although it has performed better than the benchmark Sensex, which fell by 0.46%. In the past month, the stock has risen by 4.81%, significantly outperforming the Sensex's increase of 1.72%. <BR><BR>Year-to-date, however, the stock has decreased by 12.10%, which is worse than the Sensex's decline of 9.21%. Over the past year, the stock has fallen by 31.92%, while the Sensex has only decreased by 4.84%. In the longer term, the stock has seen a significant drop of 39.00% over three years, contrasting sharply with the Sensex's gain of 18.57%. Despite this, the stock has shown a positive performance over the last five years, with a rise of 39.27%, compared to the Sensex's increase of 38.26%.<BR><BR>Today's trading performance indicates that the stock has outperformed its sector by 0.44%. Additionally, the stock's moving averages are higher than the 5-day, 20-day, and 50-day averages, although it remains below the 100-day and 200-day moving averages. There has also been a rise in investor participation, with a delivery volume of 1.78 lacs on August 21, which is up by 0.07% compared to the 5-day average. The stock's liquidity is deemed sufficient for trading, based on 2% of the 5-day average traded value.<BR><BR>Overall, while the stock price remains unchanged today, the mixed performance over different periods and the recent increase in investor participation suggest a complex situation where short-term stability contrasts with longer-term declines.

View full answer

Should I buy, sell or hold Bhandari Hosiery Exports Ltd?

15-Aug-2026

Who are in the management team of Bhandari Hosiery?

14-Aug-2026

The management team of Bhandari Hosiery includes Nitin Bhandari (Chairman/Executive Director), Vikas Nayyar, Rajesh Kumar (both Non-Executive Directors), and several Independent Non-Executive Directors: Surinder Kumar Kapoor, Geetika Bhalla, Alka Gambhir, and Komal Bhalla. Nitin Bhandari is the only member with specified remuneration of 48.0 lacs INR; the other directors do not have listed remuneration.

The management team of Bhandari Hosiery includes the following individuals:<BR><BR>1. Nitin Bhandari - Chairman / Executive Director<BR>2. Vikas Nayyar - Non Executive Director<BR>3. Rajesh Kumar - Non Executive Director<BR>4. Surinder Kumar Kapoor - Independent Non Executive Director<BR>5. Geetika Bhalla - Independent Non Executive Director<BR>6. Alka Gambhir - Independent Non Executive Director<BR>7. Komal Bhalla - Independent Non Executive Director<BR><BR>Nitin Bhandari is the only member with a specified remuneration, which is 48.0 lacs INR. The other directors do not have any remuneration listed.

View full answer

What does Bhandari Hosiery do?

14-Aug-2026

Bhandari Hosiery Exports Ltd is a micro-cap garment manufacturing company established in 1993, reporting net sales of ₹51 Cr and a net profit of ₹1 Cr for the quarter ending June 2026. Key financial metrics include a P/E ratio of 12.00 and a market cap of ₹96 Cr.

Overview: <BR>Bhandari Hosiery Exports Ltd is a garment manufacturing company in the Garments & Apparels industry, categorized as a Micro Cap.<BR><BR>History: <BR>Incorporated in November 1993 and promoted by Naresh Bhandari, the company has reported net sales and net profit for the latest quarter ending June 2026.<BR><BR>Financial Snapshot: <BR>Most recent Net Sales: 51 Cr (Quarterly Results - Jun 2026) <BR>Most recent Net Profit: 1 Cr (Quarterly Results - Jun 2026) <BR>Market-cap value: INR 96 Cr (Micro Cap)<BR><BR>Key Metrics: <BR>P/E: 12.00 <BR>Industry P/E: 28 <BR>Dividend Yield: 0.51% <BR>Debt Equity: 0.65 <BR>Return on Equity: 4.97% <BR>Price to Book: 0.61<BR><BR>Contact Details: <BR>Address: Bhandari House, Village Meharban Rahon Road Ludhiana Punjab : 141007 <BR>Tel: 91-0161-88720-16410 <BR>Email: bhandari@bhandariexport.com <BR>Website: http://www.bhandariexport.com

View full answer

Who are the peers of the Bhandari Hosiery?

14-Aug-2026

Bhandari Hosiery's peers include Digjam, KG Petrochem, Deepak Spinners, and others, with varying management and growth risks. Its 1-year return is -32.95%, better than Anand Rayons (-85.11%) but worse than Acknit Indus (10.19%).

Peers: The peers of Bhandari Hosiery are Digjam, KG Petrochem, Deepak Spinners, Addi Industries, Anand Rayons, Rel. Chemotex, Acknit Indus., SPL Industries, Globe Enterprise, and Kaytex Fabrics.<BR><BR>Quality Snapshot: Below Average management risk is observed at Digjam, KG Petrochem, Addi Industries, Rel. Chemotex, and SPL Industries, while Average management risk is found at Deepak Spinners and Acknit Indus. Anand Rayons has Average growth, while Below Average growth is noted for Digjam, KG Petrochem, Addi Industries, Bhandari Hosiery, Rel. Chemotex, and the rest. Capital Structure is Good for Deepak Spinners and SPL Industries, Average for Anand Rayons, and Below Average for Digjam, KG Petrochem, Addi Industries, Bhandari Hosiery, Rel. Chemotex, Acknit Indus., Globe Enterprise, and the rest.<BR><BR>Return Snapshot: The peer with the highest 1-year return is Acknit Indus. at 10.19%, while the lowest is Anand Rayons at -85.11%. Bhandari Hosiery's 1-year return is -32.95%, which is better than Anand Rayons but worse than Acknit Indus. Additionally, the six-month return is negative for Anand Rayons, KG Petrochem, and Bhandari Hosiery.

View full answer

How big is Bhandari Hosiery?

14-Aug-2026

As of 14th August, Bhandari Hosiery Exports Ltd has a market capitalization of 95.56 Cr, with recent net sales of 268.28 Cr and a net profit of 7.45 Cr. The company's shareholder's funds are 153.15 Cr, and total assets amount to 275.57 Cr.

As of 14th August, Bhandari Hosiery Exports Ltd has a market capitalization of 95.56 Cr, categorizing it as a Micro Cap company.<BR><BR>In the latest four quarters, Bhandari Hosiery reported Net Sales of 268.28 Cr and a Net Profit of 7.45 Cr.<BR><BR>The latest annual period for the balance sheet is March 2025, showing Shareholder's Funds of 153.15 Cr and Total Assets of 275.57 Cr.

View full answer

When is the next results date for Bhandari Hosiery Exports Ltd?

07-Aug-2026

Bhandari Hosiery Exports Ltd will announce its results on 13 August 2026.

Bhandari Hosiery Exports Ltd is scheduled to declare its results on 13 August 2026.

View full answer

Are Bhandari Hosiery Exports Ltd latest results good or bad?

30-May-2026

Bhandari Hosiery Exports Ltd's latest Q4 FY26 results show strong revenue growth of 52.50% to ₹90.05 crores, but net profit fell 13.70% quarter-on-quarter and 28.68% year-on-year, with operating margins declining to 7.76%. While revenue growth is positive, the drop in profitability raises concerns for investors.

Bhandari Hosiery Exports Ltd's latest results for Q4 FY26 present a mixed picture. On one hand, the company achieved a significant revenue increase of 52.50% quarter-on-quarter, reaching ₹90.05 crores, which is the highest quarterly revenue in at least eight quarters. This surge is attributed to strong seasonal demand typical for garment exporters.<BR><BR>However, the profitability metrics tell a different story. The net profit fell to ₹1.89 crores, down 13.70% from the previous quarter and down 28.68% year-on-year. The operating margin also declined sharply to 7.76%, marking the lowest level in eight quarters, down from 12.36% in the preceding quarter. This deterioration in profitability is concerning, especially given the elevated tax rate of 35.40%, which significantly impacted the bottom line.<BR><BR>Overall, while the revenue growth is a positive sign, the decline in net profit and operating margins raises concerns about the company's ability to maintain profitability amidst rising costs and operational challenges. Investors may view the results as unfavorable due to these profitability issues, despite the strong revenue performance.

View full answer

How has been the historical performance of Bhandari Hosiery?

14-Nov-2025

Bhandari Hosiery's historical performance shows fluctuating net sales, peaking at 283.28 Cr in March 2022, declining to 266.73 Cr in March 2024, and recovering to 278.55 Cr in March 2025, while profitability improved significantly, with profit after tax rising from 1.67 Cr in March 2021 to 7.71 Cr in March 2025. Despite some cash flow challenges, the company demonstrated resilience with asset growth and enhanced operational efficiency.

Answer:<BR>The historical performance of Bhandari Hosiery shows a fluctuating trend in net sales and profits over the years, with a notable increase in recent periods.<BR><BR>Breakdown:<BR>Bhandari Hosiery's net sales peaked at 283.28 Cr in March 2022 but saw a decline to 266.73 Cr in March 2024 before recovering slightly to 278.55 Cr in March 2025. The total operating income followed a similar pattern, reflecting the same figures as net sales. The raw material costs have remained relatively stable, with a slight decrease from 216.33 Cr in March 2023 to 201.58 Cr in March 2025. Operating profit, excluding other income, increased from 17.99 Cr in March 2021 to 28.15 Cr in March 2025, indicating improved operational efficiency. Profit before tax also showed a positive trend, rising from 2.12 Cr in March 2021 to 10.19 Cr in March 2025. Profit after tax followed suit, increasing from 1.67 Cr in March 2021 to 7.71 Cr in March 2025. The company's total assets grew from 205.13 Cr in March 2020 to 275.57 Cr in March 2025, while total liabilities increased from 205.13 Cr to 275.57 Cr in the same period. Cash flow from operating activities turned negative in March 2025 at -25.00 Cr, contrasting with a positive cash flow of 10.00 Cr in March 2024. Overall, Bhandari Hosiery has shown resilience with a gradual improvement in profitability and asset growth, despite some fluctuations in sales and cash flow.

View full answer

Who are the top shareholders of the Bhandari Hosiery?

17-Jul-2025

The top shareholder of Bhandari Hosiery is promoter Nitin Bhandari, holding 18.39%, followed by public shareholder Udyan Ashok Singhania at 1.74%. Individual investors collectively own 63.48% of the shares, with no mutual funds or foreign institutional investors involved.

The top shareholders of Bhandari Hosiery include Nitin Bhandari, who is the promoter with the highest holding at 18.39%. The highest public shareholder is Udyan Ashok Singhania, holding 1.74%. Additionally, individual investors collectively hold a significant 63.48% of the company's shares. There are no mutual funds or foreign institutional investors currently holding shares in the company, and there are no pledged promoter holdings.

View full answer

Is Bhandari Hosiery overvalued or undervalued?

16-Jun-2025

As of June 13, 2025, Bhandari Hosiery is considered very attractive with a PE ratio of 17.15 and strong growth potential, despite a recent stock price decline and underperformance compared to the Sensex, making it a compelling investment opportunity.

As of 13 June 2025, Bhandari Hosiery has moved from an attractive to a very attractive valuation grade. The company is currently undervalued, with a PE ratio of 17.15, a Price to Book Value of 0.89, and an EV to EBITDA ratio of 7.85. In comparison to its peers, K P R Mill Ltd is very expensive with a PE ratio of 45.8, while Vardhman Textile is considered expensive with a PE ratio of 15.83, highlighting Bhandari Hosiery's relative value.<BR><BR>Despite a recent decline in stock price, the company's fundamentals indicate strong potential for growth, as evidenced by a PEG ratio of 0.00 and a ROCE of 8.68%. While the stock has underperformed the Sensex year-to-date with a return of -21.28% compared to the Sensex's 3.81%, its long-term performance over five years shows a remarkable increase of 400.79%. This suggests that Bhandari Hosiery may present a compelling investment opportunity at its current valuation.

View full answer

What is the technical trend for Bhandari Hosiery?

09-Jun-2025

As of May 13, 2025, Bhandari Hosiery's technical trend is mildly bearish, with daily moving averages and monthly MACD indicating short-term weakness, despite some mildly bullish signals from the weekly MACD and Bollinger Bands.

As of 13 May 2025, the technical trend for Bhandari Hosiery has changed from bearish to mildly bearish. The weekly MACD indicates a mildly bullish stance, while the monthly MACD remains bearish. The daily moving averages are mildly bearish, suggesting short-term weakness. Bollinger Bands show a bullish signal on the weekly chart but are mildly bearish on the monthly chart. The KST and OBV both reflect a mildly bullish trend on the weekly basis, but are mildly bearish monthly. Overall, the current technical stance is mildly bearish, with key indicators such as the daily moving averages and monthly MACD contributing to this view.

View full answer

What is the bonus history of the Bhandari Hosiery?

06-Jun-2025

Bhandari Hosiery's latest bonus issue was a 7:20 ratio, announced on February 24, 2011, with a record date of February 25, 2011, meaning shareholders received 7 additional shares for every 20 shares held.

Bhandari Hosiery has a notable bonus history, with its latest bonus issue being a 7:20 ratio. This was announced with an ex-date of February 24, 2011, and the record date was February 25, 2011. This means that for every 20 shares held, shareholders received 7 additional shares as a bonus. If you have any more questions about the company or its financials, feel free to ask!

View full answer

Has Bhandari Hosiery declared dividend?

06-Jun-2025

Bhandari Hosiery Exports Ltd has declared a 2% dividend, amounting to ₹0.01 per share, with an ex-date of September 23, 2024. While recent total returns have been negative over shorter periods, the company has shown significant growth over the longer term, particularly a 419.55% total return over five years.

Bhandari Hosiery Exports Ltd has declared a 2% dividend.<BR><BR>Dividend Details:<BR>- Percentage announced: 2%<BR>- Amount per share: 0.01<BR>- Ex-date: 23 Sep 2024<BR><BR>Dividend Yield: 0.17%.<BR><BR>Total Returns by Period:<BR>In the 6-month period, the price return was -25.33%, the dividend return was 0%, resulting in a total return of -25.33%.<BR><BR>For the 1-year period, the price return was -15.48%, the dividend return was 0.14%, leading to a total return of -15.34%.<BR><BR>Over the 2-year period, the price return was 26.19%, the dividend return was 0.44%, which resulted in a total return of 26.63%.<BR><BR>In the 3-year period, the price return was -2.68%, the dividend return was 0.59%, culminating in a total return of -2.09%.<BR><BR>For the 4-year period, the price return was 114.91%, the dividend return was 1.31%, resulting in a total return of 116.22%.<BR><BR>In the 5-year period, the price return was 416.13%, the dividend return was 3.42%, leading to a total return of 419.55%.<BR><BR>Overall, while Bhandari Hosiery has declared a dividend, the total returns over shorter periods have been negative, indicating potential volatility. However, there are positive returns over the longer term, particularly in the 5-year period, suggesting growth potential.

View full answer
iScoreScore
Click here to find our call on this stock
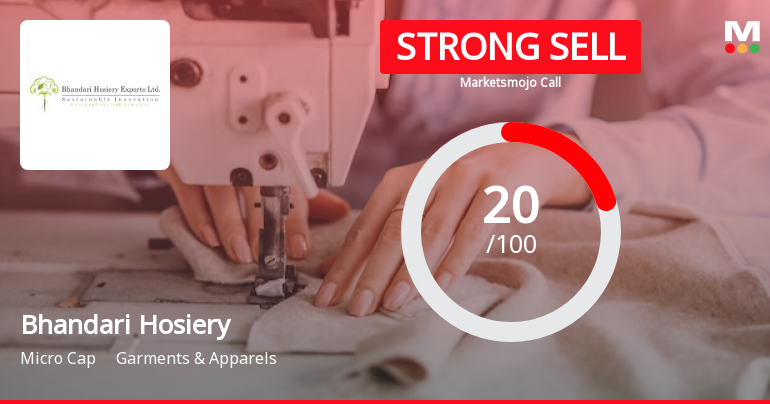
Strong Sell
Sell
Hold
Buy
Strong Buy

Dashboard

1

Weak Long Term Fundamental Strength with an average Return on Capital Employed (ROCE) of 8.86%

  • Poor long term growth as Net Sales has grown by an annual rate of 1.27% and Operating profit at 4.85% over the last 5 years
  • Low ability to service debt as the company has a high Debt to EBITDA ratio of 3.62 times
2

Negative results in Jun 26

3

Consistent Underperformance against the benchmark over the last 3 years

stock-summaryMojo Parameters

Mojo Parameters

Loading Valuation Snapshot...

Stock DNA

stock-summary
Industry

Garments & Apparels

stock-summary
Market cap

INR 101 Cr (Micro Cap)

stock-summary
P/E

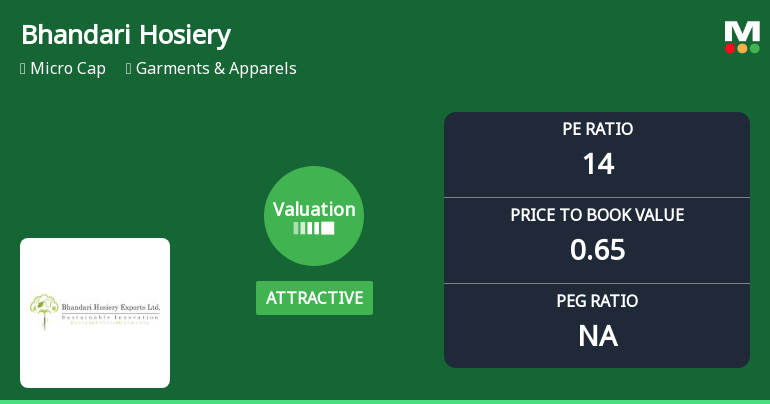
14.00

stock-summary
Industry P/E

52

stock-summary
Dividend Yield

0.00%

stock-summary
Debt Equity

0.45

stock-summary
Return on Equity

4.06%

stock-summary
Price to Book

0.55

Revenue and Profits:
Net Sales:
51 Cr
(Quarterly Results - Jun 2026)
Net Profit:
1 Cr
stock-summaryTotal Returns
Total Returns (Price + Dividend) stock-summary
Dividend Yield (0%)
TimePeriod
Price Return
Dividend Return
Total Return
3 Months
-5.3%
0.31%
-4.99%
6 Months
-0.33%
0.34%
0.01%
1 Year
-31.22%
0.23%
-30.99%
2 Years
-50.89%
0.59%
-50.3%
3 Years
-43.91%
0.82%
-43.09%
4 Years
-34.76%
1.13%
-33.63%
5 Years
42.06%
2.39%
44.45%

Latest dividend: 0.01739961759082218 per share ex-dividend date: Aug-21-2025

Risk Adjusted Returns v/s stock-summary
Returns Beta
Icon
Beta has not been calculated since enough price history is not available
stock-summaryNews & Corporate Actions

News

Announcements stock-summary

Bhandari Hosiery Exports Limited - Reply to Clarification- Financial results

21-Nov-2019 | Source : NSE

Bhandari Hosiery Exports Limiteddari Hosiery Exports Limited for the quarter ended 30-Sep-2019 with respect to Regulation 33 of the SEBI (Listing Obligations and Disclosure Requirements) Regulations, 2015.

Bhandari Hosiery Exports Limited - Outcome of Board Meeting

15-Nov-2019 | Source : NSE

Bhandari Hosiery Exports Limited has informed the Exchange regarding Board meeting held on November 14, 2019.

AGM\/Book Closure

05-Sep-2019 | Source : NSE

Bhandari Hosiery Exports Limited has informed the Exchange that?? the Register of Members & Share Transfer Books of the Company will remain closed from September 22, 2019 to September 28, 2019 (both days inclusive) for the purpose of Annual General Meeting and payment of Dividend.

Corporate Actions stock-summary

stock-summary
BOARD MEETING

No Upcoming Board Meetings

stock-summary
DIVIDEND

Bhandari Hosiery Exports Ltd has declared 1% dividend, ex-date: 08 Sep 26

stock-summary
SPLITS

Bhandari Hosiery Exports Ltd has announced 1:10 stock split, ex-date: 25 Feb 16

stock-summary
BONUS

Bhandari Hosiery Exports Ltd has announced 7:20 bonus issue, ex-date: 24 Feb 11

stock-summary
RIGHTS

Bhandari Hosiery Exports Ltd has announced 4:5 rights issue, ex-date: 25 Feb 26

stock-summaryKey Factors

Quality key factors stock-summary

Factor
Value
Sales Growth (5y)
1.27%
EBIT Growth (5y)
4.85%
EBIT to Interest (avg)
1.81
Debt to EBITDA (avg)
4.59
Net Debt to Equity (avg)
0.45
Sales to Capital Employed (avg)
1.33
Tax Ratio
25.90%
Dividend Payout Ratio
0
Pledged Shares
0
Institutional Holding
0.00%
ROCE (avg)
8.77%
ROE (avg)
6.20%

Valuation key factors

Factor
Value
P/E Ratio
14
Industry P/E
52
Price to Book Value
0.55
EV to EBIT
9.08
EV to EBITDA
6.74
EV to Capital Employed
0.69
EV to Sales
0.68
PEG Ratio
NA
Dividend Yield
NA
ROCE (Latest)
7.97%
ROE (Latest)
4.06%

Technicals key factors

Indicator
Weekly
Monthly
MACD
Mildly Bullish
Bearish
RSI
Bearish
No Signal
Bollinger Bands
Mildly Bearish
Mildly Bearish
Moving Averages
Mildly Bearish (Daily)
KST
Bearish
Bearish
Dow Theory
Mildly Bullish
No Trend
OBV
No Trend
Mildly Bearish
stock-summary Technical Indicator Scale: Bearish, Mildly Bearish, Sideways, Mildly Bullish, Bullish  Turned 
stock-summaryShareholding
Shareholding Snapshot : Jun 2026stock-summary
Shareholding Compare (%holding) stock-summary
Majority shareholders

Non Institution

Pledged Promoter Holdings

None

Mutual Funds

Held by 0 Schemes

FIIs

Held by 0 FIIs

Promoter with highest holding

Tikani Exports Limited (17.15%)

Highest Public shareholder

Udyan Ashok Singhania (1.95%)

Individual Investors Holdings

54.5%

stock-summaryFinancial
[
  {
    "link": "quarterly",
    "btn_text": "All Quarterly Results",
    "header": "Quarterly Results Snapshot (Standalone) - Jun'26 - QoQ",
    "rhs": [
      {
        "prefix": "Net Sales ",
        "suffix": "QoQ Growth in quarter ended Jun 2026 is -43.53% vs 52.50% in Mar 2026",
        "dir": -1
      },
      {
        "prefix": "Standalone Net Profit ",
        "suffix": "QoQ Growth in quarter ended Jun 2026 is -31.22% vs -13.70% in Mar 2026",
        "dir": -1
      }
    ],
    "table": {
      "header": [
        "Jun'26",
        "Mar'26",
        "Change(%)"
      ],
      "body": [
        {
          "field": "Net Sales",
          "val1": "50.85",
          "val2": "90.05",
          "chgp": "-43.53%",
          "chgp_class": "negative"
        },
        {
          "field": "Operating Profit (PBDIT) excl Other Income",
          "val1": "5.97",
          "val2": "6.99",
          "chgp": "-14.59%",
          "chgp_class": "negative"
        },
        {
          "field": "Interest",
          "val1": "2.42",
          "val2": "2.59",
          "chgp": "-6.56%",
          "chgp_class": "positive"
        },
        {
          "field": "Exceptional Items",
          "val1": "0.00",
          "val2": "0.00",
          "chgp": "",
          "chgp_class": "neutral"
        },
        {
          "field": "Standalone Net Profit",
          "val1": "1.30",
          "val2": "1.89",
          "chgp": "-31.22%",
          "chgp_class": "negative"
        },
        {
          "field": "Operating Profit Margin (Excl OI)",
          "val1": "11.74%",
          "val2": "7.76%",
          "chgp": "3.98%",
          "chgp_class": "positive"
        }
      ]
    }
  },
  {
    "link": "half-yearly",
    "btn_text": "All Half Yearly Results",
    "header": "Half Yearly Results Snapshot (Standalone) - Sep'25",
    "rhs": [
      {
        "prefix": "Net Sales ",
        "suffix": " Growth in half year ended Sep 2025 is 3.89% vs 7.39% in Sep 2024",
        "dir": -1
      },
      {
        "prefix": "Standalone Net Profit ",
        "suffix": " Growth in half year ended Sep 2025 is 19.03% vs -0.64% in Sep 2024",
        "dir": 1
      }
    ],
    "table": {
      "header": [
        "Sep'25",
        "Sep'24",
        "Change(%)"
      ],
      "body": [
        {
          "field": "Net Sales",
          "val1": "131.24",
          "val2": "126.32",
          "chgp": "3.89%",
          "chgp_class": "positive"
        },
        {
          "field": "Operating Profit (PBDIT) excl Other Income",
          "val1": "13.37",
          "val2": "13.45",
          "chgp": "-0.59%",
          "chgp_class": "negative"
        },
        {
          "field": "Interest",
          "val1": "5.15",
          "val2": "5.89",
          "chgp": "-12.56%",
          "chgp_class": "positive"
        },
        {
          "field": "Exceptional Items",
          "val1": "0.00",
          "val2": "0.00",
          "chgp": "",
          "chgp_class": "neutral"
        },
        {
          "field": "Standalone Net Profit",
          "val1": "3.69",
          "val2": "3.10",
          "chgp": "19.03%",
          "chgp_class": "positive"
        },
        {
          "field": "Operating Profit Margin (Excl OI)",
          "val1": "10.19%",
          "val2": "10.65%",
          "chgp": "-0.46%",
          "chgp_class": "negative"
        }
      ]
    }
  },
  {
    "link": "nine-monthly",
    "btn_text": "All Nine Monthly Results",
    "header": "Nine Monthly Results Snapshot (Standalone) - Dec'25",
    "rhs": [
      {
        "prefix": "Net Sales ",
        "suffix": "YoY Growth in nine months ended Dec 2025 is 0.51% vs 6.42% in Dec 2024",
        "dir": -1
      },
      {
        "prefix": "Standalone Net Profit ",
        "suffix": "YoY Growth in nine months ended Dec 2025 is 14.84% vs 4.70% in Dec 2024",
        "dir": 1
      }
    ],
    "table": {
      "header": [
        "Dec'25",
        "Dec'24",
        "Change(%)"
      ],
      "body": [
        {
          "field": "Net Sales",
          "val1": "190.29",
          "val2": "189.32",
          "chgp": "0.51%",
          "chgp_class": "positive"
        },
        {
          "field": "Operating Profit (PBDIT) excl Other Income",
          "val1": "20.67",
          "val2": "20.71",
          "chgp": "-0.19%",
          "chgp_class": "negative"
        },
        {
          "field": "Interest",
          "val1": "8.06",
          "val2": "8.65",
          "chgp": "-6.82%",
          "chgp_class": "positive"
        },
        {
          "field": "Exceptional Items",
          "val1": "0.00",
          "val2": "0.00",
          "chgp": "",
          "chgp_class": "neutral"
        },
        {
          "field": "Standalone Net Profit",
          "val1": "5.88",
          "val2": "5.12",
          "chgp": "14.84%",
          "chgp_class": "positive"
        },
        {
          "field": "Operating Profit Margin (Excl OI)",
          "val1": "10.86%",
          "val2": "10.94%",
          "chgp": "-0.08%",
          "chgp_class": "negative"
        }
      ]
    }
  },
  {
    "link": "annual",
    "btn_text": "All Annual Results",
    "header": "Annual Results Snapshot (Standalone) - Mar'26",
    "rhs": [
      {
        "prefix": "Net Sales ",
        "suffix": "YoY Growth in year ended Mar 2026 is 0.64% vs 4.43% in Mar 2025",
        "dir": -1
      },
      {
        "prefix": "Standalone Net Profit ",
        "suffix": "YoY Growth in year ended Mar 2026 is 0.78% vs 18.07% in Mar 2025",
        "dir": -1
      }
    ],
    "table": {
      "header": [
        "Mar'26",
        "Mar'25",
        "Change(%)"
      ],
      "body": [
        {
          "field": "Net Sales",
          "val1": "280.34",
          "val2": "278.55",
          "chgp": "0.64%",
          "chgp_class": "positive"
        },
        {
          "field": "Operating Profit (PBDIT) excl Other Income",
          "val1": "27.66",
          "val2": "28.15",
          "chgp": "-1.74%",
          "chgp_class": "negative"
        },
        {
          "field": "Interest",
          "val1": "10.64",
          "val2": "11.36",
          "chgp": "-6.34%",
          "chgp_class": "positive"
        },
        {
          "field": "Exceptional Items",
          "val1": "0.00",
          "val2": "0.00",
          "chgp": "",
          "chgp_class": "neutral"
        },
        {
          "field": "Standalone Net Profit",
          "val1": "7.77",
          "val2": "7.71",
          "chgp": "0.78%",
          "chgp_class": "positive"
        },
        {
          "field": "Operating Profit Margin (Excl OI)",
          "val1": "9.87%",
          "val2": "10.11%",
          "chgp": "-0.24%",
          "chgp_class": "negative"
        }
      ]
    }
  }
]

Quarterly Results Snapshot (Standalone) - Jun'26 - QoQstock-summary

Jun'26
Mar'26
Change(%)
Net Sales
50.85
90.05
-43.53%
Operating Profit (PBDIT) excl Other Income
5.97
6.99
-14.59%
Interest
2.42
2.59
-6.56%
Exceptional Items
0.00
0.00
Standalone Net Profit
1.30
1.89
-31.22%
Operating Profit Margin (Excl OI)
11.74%
7.76%
3.98%
Values in Rs Cr.
Direction Arrows
Net Sales

QoQ Growth in quarter ended Jun 2026 is -43.53% vs 52.50% in Mar 2026

Direction Arrows
Standalone Net Profit

QoQ Growth in quarter ended Jun 2026 is -31.22% vs -13.70% in Mar 2026

Half Yearly Results Snapshot (Standalone) - Sep'25stock-summary

Sep'25
Sep'24
Change(%)
Net Sales
131.24
126.32
3.89%
Operating Profit (PBDIT) excl Other Income
13.37
13.45
-0.59%
Interest
5.15
5.89
-12.56%
Exceptional Items
0.00
0.00
Standalone Net Profit
3.69
3.10
19.03%
Operating Profit Margin (Excl OI)
10.19%
10.65%
-0.46%
Values in Rs Cr.
Direction Arrows
Net Sales

Growth in half year ended Sep 2025 is 3.89% vs 7.39% in Sep 2024

Direction Arrows
Standalone Net Profit

Growth in half year ended Sep 2025 is 19.03% vs -0.64% in Sep 2024

Nine Monthly Results Snapshot (Standalone) - Dec'25stock-summary

Dec'25
Dec'24
Change(%)
Net Sales
190.29
189.32
0.51%
Operating Profit (PBDIT) excl Other Income
20.67
20.71
-0.19%
Interest
8.06
8.65
-6.82%
Exceptional Items
0.00
0.00
Standalone Net Profit
5.88
5.12
14.84%
Operating Profit Margin (Excl OI)
10.86%
10.94%
-0.08%
Values in Rs Cr.
Direction Arrows
Net Sales

YoY Growth in nine months ended Dec 2025 is 0.51% vs 6.42% in Dec 2024

Direction Arrows
Standalone Net Profit

YoY Growth in nine months ended Dec 2025 is 14.84% vs 4.70% in Dec 2024

Annual Results Snapshot (Standalone) - Mar'26stock-summary

Mar'26
Mar'25
Change(%)
Net Sales
280.34
278.55
0.64%
Operating Profit (PBDIT) excl Other Income
27.66
28.15
-1.74%
Interest
10.64
11.36
-6.34%
Exceptional Items
0.00
0.00
Standalone Net Profit
7.77
7.71
0.78%
Operating Profit Margin (Excl OI)
9.87%
10.11%
-0.24%
Values in Rs Cr.
Direction Arrows
Net Sales

YoY Growth in year ended Mar 2026 is 0.64% vs 4.43% in Mar 2025

Direction Arrows
Standalone Net Profit

YoY Growth in year ended Mar 2026 is 0.78% vs 18.07% in Mar 2025

stock-summaryCompany CV
About Bhandari Hosiery Exports Ltd stock-summary
stock-summary
Bhandari Hosiery Exports Ltd
Micro Cap
Garments & Apparels
Incorporated in November, 1993 and promoted by Naresh Bhandari, Bhandari Hosiery Exports Limited (BHEL) is a garment manufacturing company having vertical production facility to produce High Fashion Cotton Knitted Garments. The Company manufactures garments for leading international and overseas brands and some overseas retail chains. In the international market, it has presence in around 18 countries including quality conscious markets like USA, Canada, UK and the European Union.
Company Coordinates stock-summary
Company Details
Bhandari House, Village Meharban Rahon Road Ludhiana Punjab : 141007
stock-summary
Tel: 91-0161-88720-16410
stock-summary
bhandari@bhandariexport.com
Registrar Details
Link Intime India Pvt Ltd., Narang Tower 44, Community Centre, Naraina Industrial Area , Phase - 1, New Delhi