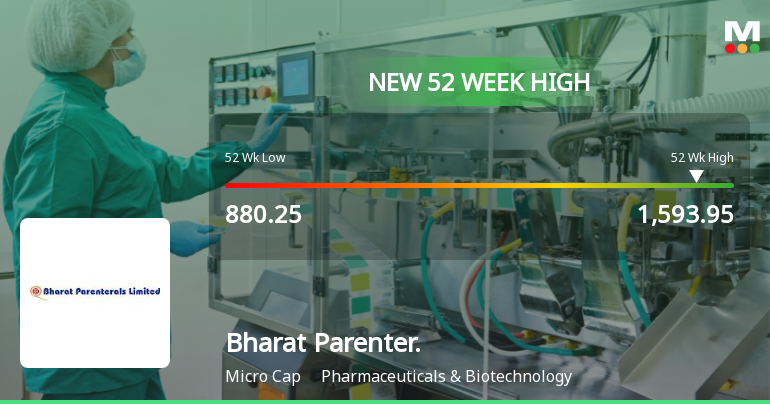
Bharat Parenter.

  • Market Cap: Micro Cap
  • Industry: Pharmaceuticals & Biotechnology
  • ISIN: INE365Y01019
  • NSEID: BPLPHARMA
  • BSEID: 541096
INR
1,522.45
-11.5 (-0.75%)
BSENSE

Sep 01, 03:30 PM

BSE+NSE Vol: 2219

  • Price Points
  • Score
  • Mojo Parameters
  • Total Return
  • News and Corporate Actions
  • Key factors
  • Shareholding
  • Financials
  • CompanyCV
stock-summaryPrice Point
High/Low

1Day

52 Week

Valuation
Technical
Day's Volume

CASH

2.22 k (-14.25%) Volume

Shareholding (Jun 2026)

FII

0.11%

Held by 1 FIIs

DII

1.37%

Held by 0 DIIs

Promoter

67.20%

Why is Bharat Parenterals Ltd falling/rising?

01-Sep-2026

As of 31-Aug, Bharat Parenterals Ltd's stock price is 1,533.95, down 0.31%. Despite this decline, the stock has gained 4.45% over the past week and 26.83% year-to-date, although a significant drop in investor participation may be impacting its current price.

As of 31-Aug, Bharat Parenterals Ltd's stock price is currently at 1,533.95, reflecting a decrease of 4.7 points or 0.31%. Despite this decline, the stock has shown a positive performance over the past week, with a gain of 4.45%, and has outperformed the Sensex, which has fallen by 0.53% during the same period. Over the last month, the stock has increased by 4.35%, while the Sensex has decreased by 1.46%. Year-to-date, Bharat Parenterals Ltd has experienced a significant rise of 26.83%, compared to a decline of 9.70% in the Sensex.<BR><BR>The stock is currently trading close to its 52-week high, just 3.57% away from Rs 1,593.95. It has also shown consistent performance, gaining for the last two days with a total return of 1.53% during this period. Furthermore, it is trading above its 5-day, 20-day, 50-day, 100-day, and 200-day moving averages, indicating a strong upward trend in the longer term.<BR><BR>However, there are some negative indicators contributing to the current price drop. Notably, there has been a significant decline in investor participation, with delivery volume on 28 August falling by 82.83% compared to the 5-day average. This reduction in trading activity may be influencing the stock's current price decline, despite its overall positive performance in the longer term. Additionally, the stock has underperformed its sector by 0.7% today, which may also be affecting investor sentiment.

View full answer

Who are in the management team of Bharat Parenter.?

01-Sep-2026

The management team of Bharat Parenter includes Bharat Kumar R Desai (Managing Director), Hemang Jayendrabhai Shah, Shaileshkumar Ghabhawala, Sanjay Shah (Directors), and independent directors Zankhana Sheth and Mukesh Patel.

The management team of Bharat Parenter includes the following individuals:<BR><BR>1. **Bharat Kumar R Desai** - Managing Director<BR>2. **Hemang Jayendrabhai Shah** - Director<BR>3. **Shaileshkumar Ghabhawala** - Director<BR>4. **Zankhana Sheth** - Independent Director<BR>5. **Mukesh Patel** - Independent Director<BR>6. **Sanjay Shah** - Director<BR><BR>If you need more information about their roles or the company's activities, feel free to ask!

View full answer

What does Bharat Parenter. do?

01-Sep-2026

Bharat Parenterals Ltd. manufactures drugs, pharmaceutical formulations, and ayurvedic products, operating as a Micro Cap company in the Pharmaceuticals & Biotechnology industry. As of June 2026, it reported net sales of 94 Cr and a net profit of 1 Cr.

Overview:<BR>Bharat Parenterals Ltd. is engaged in the manufacturing of drugs, pharmaceutical formulations, and ayurvedic products, operating within the Pharmaceuticals & Biotechnology industry and classified as a Micro Cap company.<BR><BR>History:<BR>Incorporated in September 1992 in Gujarat, Bharat Parenterals Ltd. was promoted by Ramesh Desai and Bharat Desai. The latest financial results reported are for the quarter ending June 2026, showing net sales and profit figures.<BR><BR>Financial Snapshot:<BR>- Net Sales: 94 Cr (Quarterly Results - Jun 2026)<BR>- Net Profit: 1 Cr (Quarterly Results - Jun 2026)<BR>- Market Cap: INR 1,077 Cr (Micro Cap)<BR><BR>Key Metrics:<BR>- P/E: N/A (Loss Making)<BR>- Industry P/E: 37<BR>- Dividend Yield: 0.06%<BR>- Debt Equity: 0.40<BR>- Return on Equity: -2.54%<BR>- Price to Book: 3.30<BR><BR>Contact Details:<BR>- Address: Survey No 144 & 146 Haripura, Jarod Samlaya Road Tal Savli Vadodara Gujarat : 391520<BR>- Tel: 91-2667-251679<BR>- Email: cs@bplindia.in/info@bplindia.in<BR>- Website: http://www.bplindia.in

View full answer

Who are the peers of the Bharat Parenter.?

01-Sep-2026

Bharat Parenter.'s peers include Sigachi Industries, Lincoln Pharma, Themis Medicare, Bajaj Healthcare, Kopran, Wanbury, Anlon Healthcare, Anuh Pharma, and Amanta Healthcare. Bharat Parenter. has below average management risk and growth, with a 1-year return of 12.71%, compared to peers like Kopran (40.77%) and Bajaj Healthcare (-21.10%).

Peers: The peers of Bharat Parenter. are Sigachi Indust., Lincoln Pharma., Themis Medicare, Bajaj Healthcare, Kopran, Wanbury, Anlon Healthcare, Anuh Pharma, and Amanta Healthcar.<BR><BR>Quality Snapshot: Excellent management risk is observed at Anlon Healthcare and Anuh Pharma, while Average management risk is found at Sigachi Indust., Lincoln Pharma., Themis Medicare, Bajaj Healthcare, Kopran, Wanbury, and Amanta Healthcar, and the rest. Bharat Parenter. has Below Average management risk. Growth is Excellent at Anlon Healthcare, while Average growth is noted at Wanbury and the rest, and Below Average growth is seen at Sigachi Indust., Lincoln Pharma., Themis Medicare, Bajaj Healthcare, Kopran, Bharat Parenter., Anuh Pharma, and Amanta Healthcar. Capital Structure is Excellent at Anuh Pharma, Good at Kopran and Anlon Healthcare, and Below Average at Bharat Parenter., Themis Medicare, Bajaj Healthcare, Wanbury, and Amanta Healthcar, while Excellent capital structure is observed at Sigachi Indust. and Lincoln Pharma.<BR><BR>Return Snapshot: The peer with the highest 1-year return is Kopran at 40.77%, while the lowest is Bajaj Healthcare at -21.10%. Bharat Parenter.'s 1-year return is 12.71%, which is higher than Bajaj Healthcare but lower than Kopran. Notably, Wanbury has a negative six-month return of 0.75%.

View full answer

How big is Bharat Parenter.?

01-Sep-2026

As of 31st August, Bharat Parenterals Ltd has a market capitalization of 1,077.00 Cr, with Net Sales of 323.17 Cr and a Net Profit loss of 15.41 Cr over the latest four quarters. Shareholder's Funds are 330.67 Cr and Total Assets are valued at 647.70 Cr as of March 2025.

As of 31st August, Bharat Parenterals Ltd has a market capitalization of 1,077.00 Cr, categorizing it as a Micro Cap company.<BR><BR>In the latest four quarters, Bharat Parenterals reported Net Sales of 323.17 Cr. However, the company experienced a loss of 15.41 Cr in Net Profit during the same period.<BR><BR>The latest annual period for the balance sheet is March 2025, where Shareholder's Funds amounted to 330.67 Cr and Total Assets were valued at 647.70 Cr.

View full answer

Should I buy, sell or hold Bharat Parenterals Ltd?

26-Aug-2026

When is the next results date for Bharat Parenterals Ltd?

29-Jul-2026

The next results date for Bharat Parenterals Ltd is August 5, 2026.

The next results date for Bharat Parenterals Ltd is scheduled for August 5, 2026.

View full answer

Are Bharat Parenterals Ltd latest results good or bad?

19-May-2026

Bharat Parenterals Ltd's latest results are concerning, showing a consolidated net loss of ₹4.80 crore in Q4 FY26 despite a 52.81% increase in net sales from the previous quarter. Overall, the company faces significant operational challenges, with a full-year net loss of ₹43 crore and a weak return on equity of 6.41%.

Bharat Parenterals Ltd's latest results indicate a challenging situation for the company. In the fourth quarter of FY26, the company reported a consolidated net loss of ₹4.80 crore, which, while representing a lower loss compared to the previous quarter, still reflects ongoing financial difficulties. <BR><BR>Net sales for the quarter were ₹99.62 crore, showing a significant sequential increase of 52.81% from the previous quarter. However, this figure is down 4.19% year-on-year, indicating a decline in revenue compared to the same period last year. The operating margin, excluding other income, was negative at -0.53%, marking the lowest operating profitability in recent quarters. This decline in operating margin is concerning, especially given the previous year's operating margin of 11.88% in Q1 FY25.<BR><BR>The full fiscal year FY25 was particularly troubling, with a consolidated net loss of ₹43 crore on revenues of ₹340 crore, a stark contrast to a profit of ₹10 crore in FY24. The company's return on equity (ROE) stands at a weak 6.41%, indicating poor capital efficiency.<BR><BR>Overall, while there is a slight improvement in the net loss on a quarter-over-quarter basis, the underlying operational challenges and persistent losses suggest that the results are more bad than good. The company is facing significant hurdles that need to be addressed to achieve a turnaround.

View full answer

Is Bharat Parenter. technically bullish or bearish?

05-Dec-2025

As of December 4, 2025, Bharat Parenter's technical outlook is bearish, indicated by a bearish MACD, moving averages, and KST, along with mildly bearish Bollinger Bands, suggesting a consolidation phase without a clear trend.

As of 4 December 2025, the technical trend has changed from mildly bearish to bearish. The current technical stance is bearish with a moderate strength. Key indicators driving this stance include a bearish MACD on the weekly chart, bearish moving averages on the daily chart, and a bearish KST on the weekly chart. Additionally, Bollinger Bands are indicating a mildly bearish trend on both weekly and monthly time frames. The lack of signals from the RSI and Dow Theory suggests a consolidation phase without a clear trend. Overall, the technical outlook for Bharat Parenter is bearish.

View full answer

How has been the historical performance of Bharat Parenter.?

13-Nov-2025

Bharat Parenter has experienced significant revenue growth, with net sales rising from INR 204.64 crore in March 2021 to INR 340.38 crore in March 2025. However, rising costs have led to declining profitability, resulting in a net loss of -INR 12.63 crore in March 2025.

Answer:<BR>The historical performance of Bharat Parenter shows significant fluctuations in key financial metrics over the years, culminating in a challenging fiscal year ending March 2025.<BR><BR>Breakdown:<BR>Bharat Parenter's net sales have shown a steady increase from INR 204.64 crore in March 2021 to INR 340.38 crore in March 2025, reflecting a strong growth trajectory. However, total operating income followed a similar trend, reaching INR 340.38 crore in March 2025, up from INR 261.22 crore in March 2024. Despite this growth in revenue, the company faced rising raw material costs, which increased from INR 127.13 crore in March 2021 to INR 178.17 crore in March 2025. Consequently, total expenditure also rose significantly, leading to an operating profit (PBDIT) of only INR 2.70 crore in March 2025, a sharp decline from INR 27.08 crore in March 2024. This decline in profitability is further highlighted by a profit before tax of -INR 33.95 crore in March 2025, compared to a profit of INR 18.72 crore in March 2024. The net profit also turned negative, recording -INR 12.63 crore in March 2025, down from a profit of INR 14.51 crore in March 2024. On the balance sheet, total liabilities increased to INR 647.70 crore in March 2025 from INR 503.93 crore in March 2024, while total assets rose to INR 647.70 crore, indicating a growing leverage position. Cash flow from operating activities turned negative at -INR 4.00 crore in March 2024, contrasting with the previous year's positive cash flow. Overall, while Bharat Parenter has achieved revenue growth, it has struggled with profitability and rising costs, leading to a challenging financial position in recent years.

View full answer

Who are the top shareholders of the Bharat Parenter.?

17-Jul-2025

The top shareholder of Bharat Parenter is Desai Shares And Stock Private Limited, holding 39.63%. Other notable shareholders include Asoj Soft Caps Pvt Ltd at 4.94% and individual investors with a collective stake of 19.31%.

The top shareholders of Bharat Parenter include Desai Shares And Stock Private Limited, which holds the highest promoter stake at 39.63%. The company has no pledged promoter holdings, and there is one foreign institutional investor (FII) holding 0.11%. The highest public shareholder is Asoj Soft Caps Pvt Ltd, with a stake of 4.94%. Additionally, individual investors collectively hold 19.31% of the company's shares.

View full answer

Is Bharat Parenter. overvalued or undervalued?

09-Jun-2025

As of August 9, 2024, Bharat Parenterals Ltd. is considered risky and overvalued, with alarming financial metrics such as a PE ratio of -73.55 and an EV to EBITDA ratio of 385.93, despite recent stock performance outpacing the Sensex.

As of 9 August 2024, Bharat Parenterals Ltd. has moved from a valuation grade of very expensive to risky, indicating a significant shift in its perceived value. The company is currently deemed overvalued, particularly highlighted by its PE ratio of -73.55 and an EV to EBITDA ratio of 385.93, which are both alarming figures suggesting substantial concerns regarding profitability and valuation metrics. Additionally, the Price to Book Value stands at 2.81, further reinforcing the notion of overvaluation.<BR><BR>In comparison to its peers, Bharat Parenterals Ltd. shows a stark contrast; for instance, its PE ratio is significantly worse than the industry average, and the EV to EBITDA ratio is exceedingly high compared to typical benchmarks. The company's recent stock performance has outpaced the Sensex over the past week and month, with returns of 9.29% and 24.85% respectively, but this does not mitigate the underlying valuation concerns. Overall, the financial metrics indicate that Bharat Parenterals Ltd. is not only risky but also overvalued in the current market landscape.

View full answer

Has Bharat Parenter. declared dividend?

06-Jun-2025

Bharat Parenterals Ltd has declared a 10% dividend, amounting to ₹1 per share, with an ex-date of June 25, 2024. Recent total returns show a -22.1% return over the last 6 months, while longer-term returns have been more favorable, with a total return of 396.85% over the past 5 years.

Bharat Parenterals Ltd has declared a 10% dividend.<BR><BR>Dividend Details:<BR>- Percentage announced: 10%<BR>- Amount per share: 1 per share<BR>- Ex-date: 25 Jun 24<BR><BR>Dividend Yield: 0.07%.<BR><BR>Total Returns by Period:<BR>In the last 6 months, the price return was -22.1%, with a dividend return of 0%, resulting in a total return of -22.1%.<BR><BR>Over the past year, the price return was -2.33%, the dividend return was 0.07%, leading to a total return of -2.26%.<BR><BR>In the 2-year period, the price return was 262.84%, the dividend return was 0.45%, culminating in a total return of 263.29%.<BR><BR>For the 3-year period, the price return stood at 273.76%, with a dividend return of 0.53%, resulting in a total return of 274.29%.<BR><BR>In the 4-year period, the price return was 200.0%, the dividend return was 0.47%, leading to a total return of 200.47%.<BR><BR>Over the last 5 years, the price return was 396.26%, with a dividend return of 0.59%, resulting in a total return of 396.85%.<BR><BR>Overall, Bharat Parenterals Ltd has declared a dividend, but the recent total returns indicate significant fluctuations, particularly in the short term, while longer-term returns have been more favorable.

View full answer
iScoreScore
Click here to find our call on this stock
Strong Sell
Sell
Hold
Buy
Strong Buy

Dashboard

1

Weak Long Term Fundamental Strength with a -202.20% CAGR growth in Operating Profits over the last 5 years

  • The company has been able to generate a Return on Equity (avg) of 5.81% signifying low profitability per unit of shareholders funds
2

Negative results in Jun 26

3

Risky - Negative Operating Profits

4

Despite the size of the company, domestic mutual funds hold only 0% of the company

stock-summaryMojo Parameters

Mojo Parameters

Loading Valuation Snapshot...

Stock DNA

stock-summary
Industry

Pharmaceuticals & Biotechnology

stock-summary
Market cap

INR 1,083 Cr (Micro Cap)

stock-summary
P/E

NA (Loss Making)

stock-summary
Industry P/E

37

stock-summary
Dividend Yield

0.07%

stock-summary
Debt Equity

0.40

stock-summary
Return on Equity

-2.54%

stock-summary
Price to Book

3.29

Revenue and Profits:
Net Sales:
94 Cr
(Quarterly Results - Jun 2026)
Net Profit:
1 Cr
stock-summaryTotal Returns
Total Returns (Price + Dividend) stock-summary
Dividend Yield (0.07%)
TimePeriod
Price Return
Dividend Return
Total Return
3 Months
14.83%
0.07%
14.9%
6 Months
33.26%
0.09%
33.35%
1 Year
10.32%
0.15%
10.47%
2 Years
-6.69%
0.13%
-6.56%
3 Years
153.53%
0.66%
154.19%
4 Years
366.29%
1.12%
367.41%
5 Years
304.64%
0.99%
305.63%

Latest dividend: 1 per share ex-dividend date: Sep-19-2025

Risk Adjusted Returns v/s stock-summary
Returns Beta
Icon
Beta has not been calculated since enough price history is not available
stock-summaryNews & Corporate Actions

News

Bharat Parenterals Gains 11.26%: 4 Key Factors Driving the Week’s Momentum

Announcements stock-summary

Announcement under Regulation 30 (LODR)-Newspaper Publication

28-Aug-2026 | Source : BSE

Please find the enclosed newspaper publications intimating details of 33rd Annual General Meeting of the company schedule on September 19 2026.

Intimation Of The Record Date For The Purpose Of The Dividend For FY 2025-26.

27-Aug-2026 | Source : BSE

Intimation of Record Date for the purpose of Payment of Dividend for the FY 2025-26.

Intimation Under Regulation 36 Of The SEBI (LODR) Regulations 2015.

27-Aug-2026 | Source : BSE

Please find the enclosed copy of the letter dispatched by the company to the shareholders (whose email id not registered) for providing details to access the Annual Report for FY 2025-26.

Corporate Actions stock-summary

stock-summary
BOARD MEETING

No Upcoming Board Meetings

stock-summary
DIVIDEND

Bharat Parenterals Ltd has declared 10% dividend, ex-date: 11 Sep 26

stock-summary
SPLITS

No Splits history available

stock-summary
BONUS

No Bonus history available

stock-summary
RIGHTS

No Rights history available

stock-summaryKey Factors

Quality key factors stock-summary

Factor
Value
Sales Growth (5y)
8.94%
EBIT Growth (5y)
-202.20%
EBIT to Interest (avg)
3.32
Debt to EBITDA (avg)
12.86
Net Debt to Equity (avg)
0.40
Sales to Capital Employed (avg)
0.86
Tax Ratio
17.84%
Dividend Payout Ratio
-5.46%
Pledged Shares
0
Institutional Holding
1.48%
ROCE (avg)
3.12%
ROE (avg)
5.81%

Valuation key factors

Factor
Value
P/E Ratio
NA (Loss Making)
Industry P/E
37
Price to Book Value
3.30
EV to EBIT
-50.18
EV to EBITDA
112.70
EV to Capital Employed
2.64
EV to Sales
3.69
PEG Ratio
NA
Dividend Yield
0.06%
ROCE (Latest)
-4.08%
ROE (Latest)
-2.54%

Technicals key factors

Indicator
Weekly
Monthly
MACD
Bullish
Bullish
RSI
No Signal
No Signal
Bollinger Bands
Bullish
Bullish
Moving Averages
Bullish (Daily)
KST
Mildly Bearish
Bullish
Dow Theory
No Trend
No Trend
OBV
No Trend
No Trend
stock-summary Technical Indicator Scale: Bearish, Mildly Bearish, Sideways, Mildly Bullish, Bullish  Turned 
stock-summaryShareholding
Shareholding Snapshot : Jun 2026stock-summary
Shareholding Compare (%holding) stock-summary
Majority shareholders

Promoters

Pledged Promoter Holdings

None

Mutual Funds

Held by 0 Schemes

FIIs

Held by 1 FIIs (0.11%)

Promoter with highest holding

Desai Shares And Stock Private Limited (39.67%)

Highest Public shareholder

Asoj Soft Caps Pvtltd(anchor) (4.94%)

Individual Investors Holdings

18.54%

stock-summaryFinancial
[
  {
    "link": "quarterly",
    "btn_text": "All Quarterly Results",
    "header": "Quarterly Results Snapshot (Consolidated) - Jun'26 - YoY",
    "rhs": [
      {
        "prefix": "Net Sales ",
        "suffix": "YoY Growth in quarter ended Jun 2026 is -19.19% vs 25.39% in Jun 2025",
        "dir": -1
      },
      {
        "prefix": "Consolidated Net Profit ",
        "suffix": "YoY Growth in quarter ended Jun 2026 is -87.73% vs 542.97% in Jun 2025",
        "dir": -1
      }
    ],
    "table": {
      "header": [
        "Jun'26",
        "Jun'25",
        "Change(%)"
      ],
      "body": [
        {
          "field": "Net Sales",
          "val1": "93.74",
          "val2": "116.00",
          "chgp": "-19.19%",
          "chgp_class": "negative"
        },
        {
          "field": "Operating Profit (PBDIT) excl Other Income",
          "val1": "8.54",
          "val2": "13.77",
          "chgp": "-37.98%",
          "chgp_class": "negative"
        },
        {
          "field": "Interest",
          "val1": "2.45",
          "val2": "3.69",
          "chgp": "-33.60%",
          "chgp_class": "positive"
        },
        {
          "field": "Exceptional Items",
          "val1": "0.00",
          "val2": "0.00",
          "chgp": "",
          "chgp_class": "neutral"
        },
        {
          "field": "Consolidate Net Profit",
          "val1": "1.01",
          "val2": "8.23",
          "chgp": "-87.73%",
          "chgp_class": "negative"
        },
        {
          "field": "Operating Profit Margin (Excl OI)",
          "val1": "9.11%",
          "val2": "11.87%",
          "chgp": "-2.76%",
          "chgp_class": "negative"
        }
      ]
    }
  },
  {
    "link": "half-yearly",
    "btn_text": "All Half Yearly Results",
    "header": "Half Yearly Results Snapshot (Consolidated) - Sep'25",
    "rhs": [
      {
        "prefix": "Net Sales ",
        "suffix": " Growth in half year ended Sep 2025 is 10.04% vs 26.53% in Sep 2024",
        "dir": -1
      },
      {
        "prefix": "Consolidated Net Profit ",
        "suffix": " Growth in half year ended Sep 2025 is 115.89% vs -156.43% in Sep 2024",
        "dir": 1
      }
    ],
    "table": {
      "header": [
        "Sep'25",
        "Sep'24",
        "Change(%)"
      ],
      "body": [
        {
          "field": "Net Sales",
          "val1": "180.62",
          "val2": "164.14",
          "chgp": "10.04%",
          "chgp_class": "positive"
        },
        {
          "field": "Operating Profit (PBDIT) excl Other Income",
          "val1": "14.59",
          "val2": "-3.17",
          "chgp": "560.25%",
          "chgp_class": "positive"
        },
        {
          "field": "Interest",
          "val1": "6.79",
          "val2": "5.68",
          "chgp": "19.54%",
          "chgp_class": "negative"
        },
        {
          "field": "Exceptional Items",
          "val1": "0.00",
          "val2": "0.00",
          "chgp": "",
          "chgp_class": "neutral"
        },
        {
          "field": "Consolidate Net Profit",
          "val1": "0.99",
          "val2": "-6.23",
          "chgp": "115.89%",
          "chgp_class": "positive"
        },
        {
          "field": "Operating Profit Margin (Excl OI)",
          "val1": "8.08%",
          "val2": "-1.93%",
          "chgp": "10.01%",
          "chgp_class": "positive"
        }
      ]
    }
  },
  {
    "link": "nine-monthly",
    "btn_text": "All Nine Monthly Results",
    "header": "Nine Monthly Results Snapshot (Consolidated) - Dec'25",
    "rhs": [
      {
        "prefix": "Net Sales ",
        "suffix": "YoY Growth in nine months ended Dec 2025 is 3.98% vs 24.72% in Dec 2024",
        "dir": -1
      },
      {
        "prefix": "Consolidated Net Profit ",
        "suffix": "YoY Growth in nine months ended Dec 2025 is 56.96% vs -153.31% in Dec 2024",
        "dir": 1
      }
    ],
    "table": {
      "header": [
        "Dec'25",
        "Dec'24",
        "Change(%)"
      ],
      "body": [
        {
          "field": "Net Sales",
          "val1": "245.81",
          "val2": "236.40",
          "chgp": "3.98%",
          "chgp_class": "positive"
        },
        {
          "field": "Operating Profit (PBDIT) excl Other Income",
          "val1": "16.34",
          "val2": "0.47",
          "chgp": "3,376.60%",
          "chgp_class": "positive"
        },
        {
          "field": "Interest",
          "val1": "9.69",
          "val2": "9.01",
          "chgp": "7.55%",
          "chgp_class": "negative"
        },
        {
          "field": "Exceptional Items",
          "val1": "0.00",
          "val2": "0.00",
          "chgp": "",
          "chgp_class": "neutral"
        },
        {
          "field": "Consolidate Net Profit",
          "val1": "-3.40",
          "val2": "-7.90",
          "chgp": "56.96%",
          "chgp_class": "positive"
        },
        {
          "field": "Operating Profit Margin (Excl OI)",
          "val1": "6.65%",
          "val2": "0.20%",
          "chgp": "6.45%",
          "chgp_class": "positive"
        }
      ]
    }
  },
  {
    "link": "annual",
    "btn_text": "All Annual Results",
    "header": "Annual Results Snapshot (Consolidated) - Mar'26",
    "rhs": [
      {
        "prefix": "Net Sales ",
        "suffix": "YoY Growth in year ended Mar 2026 is 1.48% vs 30.30% in Mar 2025",
        "dir": -1
      },
      {
        "prefix": "Consolidated Net Profit ",
        "suffix": "YoY Growth in year ended Mar 2026 is 35.15% vs -187.04% in Mar 2025",
        "dir": 1
      }
    ],
    "table": {
      "header": [
        "Mar'26",
        "Mar'25",
        "Change(%)"
      ],
      "body": [
        {
          "field": "Net Sales",
          "val1": "345.43",
          "val2": "340.38",
          "chgp": "1.48%",
          "chgp_class": "positive"
        },
        {
          "field": "Operating Profit (PBDIT) excl Other Income",
          "val1": "15.82",
          "val2": "2.70",
          "chgp": "485.93%",
          "chgp_class": "positive"
        },
        {
          "field": "Interest",
          "val1": "12.53",
          "val2": "12.95",
          "chgp": "-3.24%",
          "chgp_class": "positive"
        },
        {
          "field": "Exceptional Items",
          "val1": "0.00",
          "val2": "0.00",
          "chgp": "",
          "chgp_class": "neutral"
        },
        {
          "field": "Consolidate Net Profit",
          "val1": "-8.19",
          "val2": "-12.63",
          "chgp": "35.15%",
          "chgp_class": "positive"
        },
        {
          "field": "Operating Profit Margin (Excl OI)",
          "val1": "4.58%",
          "val2": "0.79%",
          "chgp": "3.79%",
          "chgp_class": "positive"
        }
      ]
    }
  }
]

Quarterly Results Snapshot (Consolidated) - Jun'26 - YoYstock-summary

Jun'26
Jun'25
Change(%)
Net Sales
93.74
116.00
-19.19%
Operating Profit (PBDIT) excl Other Income
8.54
13.77
-37.98%
Interest
2.45
3.69
-33.60%
Exceptional Items
0.00
0.00
Consolidate Net Profit
1.01
8.23
-87.73%
Operating Profit Margin (Excl OI)
9.11%
11.87%
-2.76%
Values in Rs Cr.
Direction Arrows
Net Sales

YoY Growth in quarter ended Jun 2026 is -19.19% vs 25.39% in Jun 2025

Direction Arrows
Consolidated Net Profit

YoY Growth in quarter ended Jun 2026 is -87.73% vs 542.97% in Jun 2025

Half Yearly Results Snapshot (Consolidated) - Sep'25stock-summary

Sep'25
Sep'24
Change(%)
Net Sales
180.62
164.14
10.04%
Operating Profit (PBDIT) excl Other Income
14.59
-3.17
560.25%
Interest
6.79
5.68
19.54%
Exceptional Items
0.00
0.00
Consolidate Net Profit
0.99
-6.23
115.89%
Operating Profit Margin (Excl OI)
8.08%
-1.93%
10.01%
Values in Rs Cr.
Direction Arrows
Net Sales

Growth in half year ended Sep 2025 is 10.04% vs 26.53% in Sep 2024

Direction Arrows
Consolidated Net Profit

Growth in half year ended Sep 2025 is 115.89% vs -156.43% in Sep 2024

Nine Monthly Results Snapshot (Consolidated) - Dec'25stock-summary

Dec'25
Dec'24
Change(%)
Net Sales
245.81
236.40
3.98%
Operating Profit (PBDIT) excl Other Income
16.34
0.47
3,376.60%
Interest
9.69
9.01
7.55%
Exceptional Items
0.00
0.00
Consolidate Net Profit
-3.40
-7.90
56.96%
Operating Profit Margin (Excl OI)
6.65%
0.20%
6.45%
Values in Rs Cr.
Direction Arrows
Net Sales

YoY Growth in nine months ended Dec 2025 is 3.98% vs 24.72% in Dec 2024

Direction Arrows
Consolidated Net Profit

YoY Growth in nine months ended Dec 2025 is 56.96% vs -153.31% in Dec 2024

Annual Results Snapshot (Consolidated) - Mar'26stock-summary

Mar'26
Mar'25
Change(%)
Net Sales
345.43
340.38
1.48%
Operating Profit (PBDIT) excl Other Income
15.82
2.70
485.93%
Interest
12.53
12.95
-3.24%
Exceptional Items
0.00
0.00
Consolidate Net Profit
-8.19
-12.63
35.15%
Operating Profit Margin (Excl OI)
4.58%
0.79%
3.79%
Values in Rs Cr.
Direction Arrows
Net Sales

YoY Growth in year ended Mar 2026 is 1.48% vs 30.30% in Mar 2025

Direction Arrows
Consolidated Net Profit

YoY Growth in year ended Mar 2026 is 35.15% vs -187.04% in Mar 2025

stock-summaryCompany CV
About Bharat Parenterals Ltd stock-summary
stock-summary
Bharat Parenterals Ltd
Micro Cap
Pharmaceuticals & Biotechnology
Bharat Parenterals Ltd. was incorporated on Sep.'92 in Gujarat and promoted by Ramesh Desai and Bharat Desai. The Company is engaged in the business of manufacturing drugs, pharmaceutical formulations and ayurvedic products at its plant in Baroda. It has set-up a fully integrated and modern plant as per WHO standards at Haripura near Baroda for manufacturing pharmaceutical formulations, life saving drugs, parenterals and antibiotics.
Company Coordinates stock-summary
Company Details
Survey No 144 & 146 Haripura, Jarod Samlaya Road Tal Savli Vadodara Gujarat : 391520
stock-summary
Tel: 91-2667-251679
stock-summary
cs@bplindia.in/info@bplindia.in
Registrar Details