
Compare Bhartiya Intl. with Similar Stocks
Dashboard
Low ability to service debt as the company has a high Debt to EBITDA ratio of 4.51 times
- Low ability to service debt as the company has a high Debt to EBITDA ratio of 4.51 times
- The company has been able to generate a Return on Equity (avg) of 4.49% signifying low profitability per unit of shareholders funds
Flat results in Mar 26
Despite the size of the company, domestic mutual funds hold only 0% of the company
Stock DNA
Diversified consumer products
INR 932 Cr (Micro Cap)
70.00
37
0.00%
0.90
2.76%
1.93
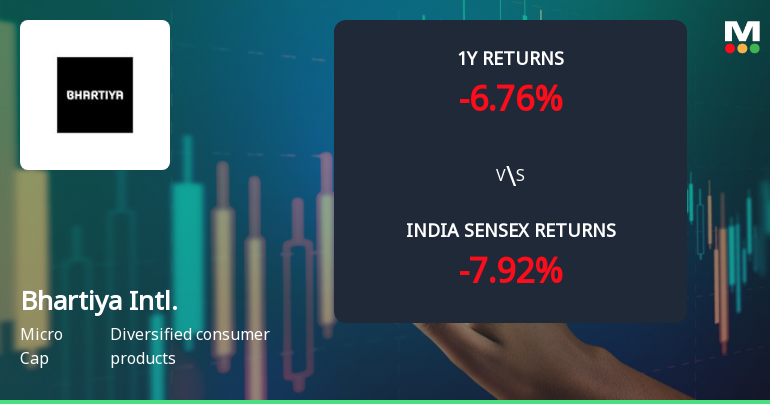
Total Returns (Price + Dividend) 
Latest dividend: 1.2 per share ex-dividend date: Sep-18-2019
Risk Adjusted Returns v/s
Returns Beta

News
Bhartiya International Ltd Shares Bearish Momentum Amid Technical Downgrade
Bhartiya International Ltd, a micro-cap player in the diversified consumer products sector, has seen a marked shift in its technical momentum, with key indicators signalling a bearish trend. The stock’s recent downgrade from a Strong Sell to a Sell rating reflects deteriorating market sentiment, compounded by a 5.20% decline in its share price on 4 June 2026.
Read full news article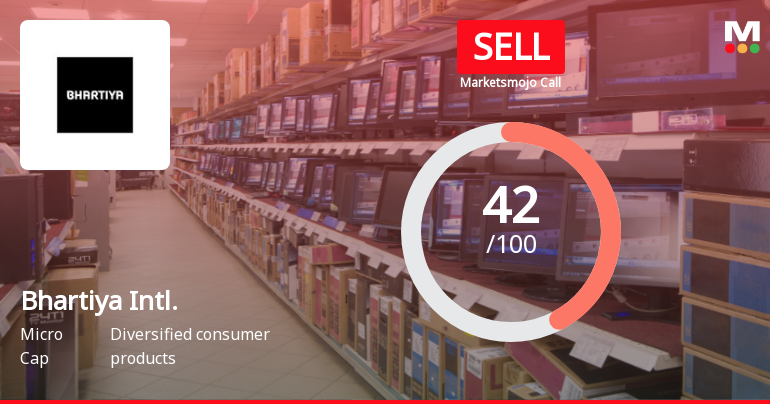
Bhartiya International Ltd Upgraded from Strong Sell to Sell on Financial and Quality Metrics
Bhartiya International Ltd, a micro-cap player in the diversified consumer products sector, has seen its investment rating upgraded from Strong Sell to Sell as of 1 June 2026. This change reflects a nuanced reassessment across four key parameters: quality, valuation, financial trend, and technicals. Despite recent flat financial performance and a sharp decline in profitability, improvements in quality metrics and valuation have contributed to a more balanced outlook for investors.
Read full news article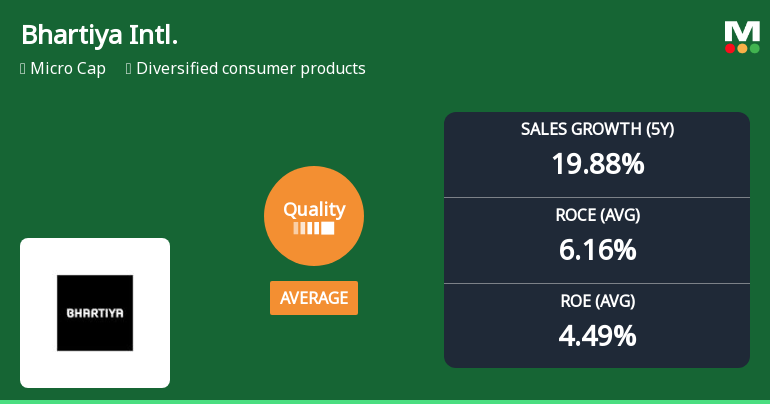
Bhartiya International Ltd Quality Parameters Show Marked Improvement Amid Mixed Financial Metrics
Bhartiya International Ltd has seen its quality grading improve from below average to average, signalling a notable shift in its business fundamentals. This upgrade reflects changes in key financial metrics such as return on equity (ROE), return on capital employed (ROCE), debt levels, and growth consistency. Despite a recent share price decline of 5.16%, the company’s fundamentals warrant a closer examination to understand the drivers behind this positive reassessment and the challenges that remain.
Read full news article Announcements
Announcement under Regulation 30 (LODR)-Newspaper Publication
30-May-2026 | Source : BSENewspaper publication of Audited Financial Results for quarter and year ended 31st March 2026
Board Meeting Outcome for Outcome Of Board Meeting
29-May-2026 | Source : BSEOutcome of Board Meeting
Audited Financial Results For The Quarter And Year Ended 31.03.2026
29-May-2026 | Source : BSEAudited Financial Results for the quarter and year ended 31.03.2026.
Corporate Actions

No Upcoming Board Meetings

Bhartiya International Ltd has declared 12% dividend, ex-date: 18 Sep 19

No Splits history available

No Bonus history available

No Rights history available
Quality key factors
Valuation key factors
Technicals key factors
 Technical Indicator Scale: Bearish, Mildly Bearish, Sideways, Mildly Bullish, Bullish Turned
 Shareholding Snapshot : Mar 2026
Shareholding Compare (%holding)
Promoters
None
Held by 0 Schemes
Held by 0 FIIs
Bhartiya Global Ventures Private Limited (22.72%)
Chartered Finance & Leasing Limited (5.89%)
16.66%
Quarterly Results Snapshot (Consolidated) - Mar'26 - YoY

YoY Growth in quarter ended Mar 2026 is 29.68% vs 34.22% in Mar 2025
YoY Growth in quarter ended Mar 2026 is -158.85% vs 950.70% in Mar 2025
Half Yearly Results Snapshot (Consolidated) - Sep'25
Growth in half year ended Sep 2025 is 29.36% vs 31.45% in Sep 2024

Growth in half year ended Sep 2025 is 586.73% vs 10.24% in Sep 2024
Nine Monthly Results Snapshot (Consolidated) - Dec'25
YoY Growth in nine months ended Dec 2025 is 32.63% vs 31.82% in Dec 2024
YoY Growth in nine months ended Dec 2025 is 2,862.67% vs 162.50% in Dec 2024
Annual Results Snapshot (Consolidated) - Mar'26
YoY Growth in year ended Mar 2026 is 31.94% vs 32.38% in Mar 2025
YoY Growth in year ended Mar 2026 is -14.18% vs 7,018.18% in Mar 2025
About Bhartiya International Ltd

Company Coordinates


