
Compare Bihar Sponge with Similar Stocks
Dashboard
With a Negative Book Value, the company has a Weak Long Term Fundamental Strength
- Poor long term growth as Net Sales has grown by an annual rate of 61.88% and Operating profit at 0% over the last 5 years
- The company has a negative book value of Rs 34.01 crore
- NET SALES(Q) At Rs 16.92 cr has Fallen at -79.3% (vs previous 4Q average)
- PAT(Q) At Rs 1.25 cr has Fallen at -62.8% (vs previous 4Q average)
- NON-OPERATING INCOME(Q) is 444.80 % of Profit Before Tax (PBT)
Risky - Negative EBITDA
52.05% of Promoter Shares are Pledged
Stock DNA
Ferrous Metals
INR 111 Cr (Micro Cap)
10.00
26
0.00%
-0.72
-33.31%
-3.26
Total Returns (Price + Dividend) 
Bihar Sponge for the last several years.
Risk Adjusted Returns v/s
Returns Beta

News
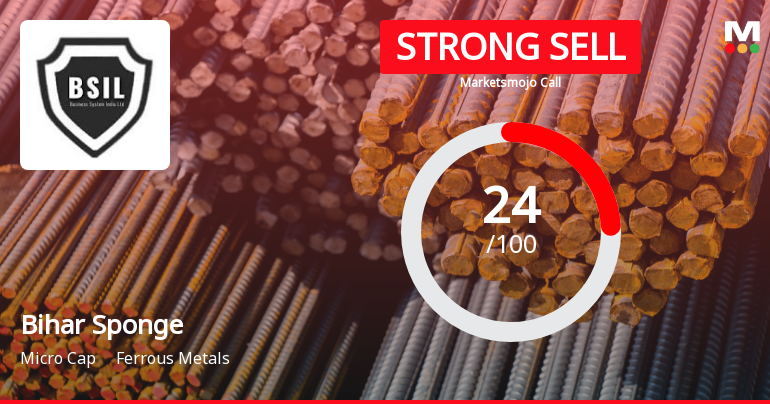
Bihar Sponge Iron Ltd Downgraded to Strong Sell Amid Financial and Valuation Concerns
Bihar Sponge Iron Ltd has been downgraded from a Sell to a Strong Sell rating as of 2 June 2026, reflecting deteriorating financial trends and mixed technical signals. Despite some long-term market outperformance, the company’s recent quarterly results and valuation metrics have raised significant concerns, prompting a reassessment of its investment appeal within the ferrous metals sector.
Read full news article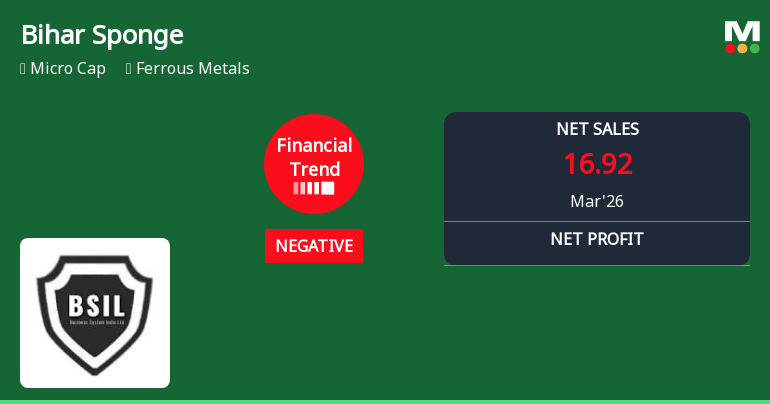
Bihar Sponge Iron Ltd Reports Sharp Quarterly Decline Amid Negative Financial Trend
Bihar Sponge Iron Ltd, a micro-cap player in the ferrous metals sector, has witnessed a marked deterioration in its financial performance for the quarter ended March 2026. The company’s financial trend score plunged from a positive 17 to a negative -7 over the past three months, signalling a significant reversal in growth momentum and profitability metrics.
Read full news article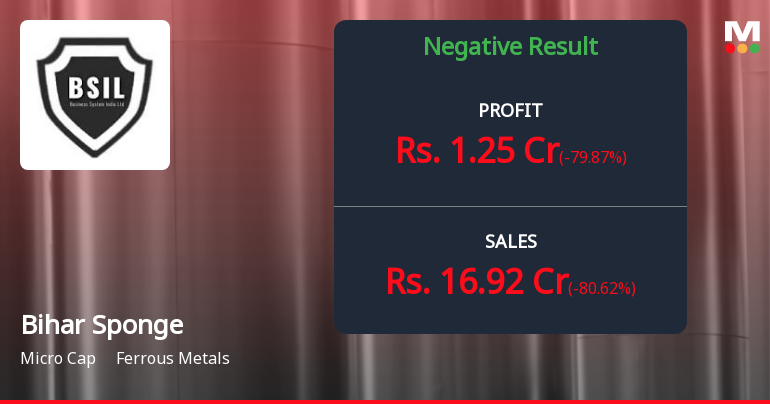
Bihar Sponge Iron Q4 FY26: Revenue Collapse Masks Other Income Dependence
Bihar Sponge Iron Ltd., the first merchant sponge iron plant in India, reported deeply concerning Q4 FY26 results that exposed fundamental operational weaknesses. Net profit stood at ₹1.25 crores for the quarter ended March 2026, plummeting 62.80% quarter-on-quarter from ₹3.36 crores in Q3 FY26, whilst declining 62.80% year-on-year. The company's shares, trading at ₹13.86 on the NSE, fell 4.94% following the announcement, reflecting investor anxiety over the dramatic deterioration in core business performance.
Read full news article Announcements
Announcement under Regulation 30 (LODR)-Newspaper Publication
30-May-2026 | Source : BSENewspaper Publication of Results
Board Meeting Outcome for Audited Financial Results For The 4Th Quarter And Year Ended 31St March 2026 And Outcome Of Board Meeting Held On 29Th May 2026
29-May-2026 | Source : BSEAudited Financial Results for the 4th quarter and year ended 31st March 2026 and outcome of Board Meeting held on 29th May 2026
Audited Financial Results For The 4Th Quarter And Year Ended 31St March 2026 Outcome & Disclosure Of Board Meeting Held On 29Th May 2026
29-May-2026 | Source : BSEDisclosure under regulation 30 of LODR 2015.
Corporate Actions

No Upcoming Board Meetings

No Dividend history available

No Splits history available

No Bonus history available

No Rights history available
Quality key factors
Valuation key factors
Technicals key factors
 Technical Indicator Scale: Bearish, Mildly Bearish, Sideways, Mildly Bullish, Bullish Turned
 Shareholding Snapshot : Mar 2026
Shareholding Compare (%holding)
Promoters
52.0451
Held by 14 Schemes (0.07%)
Held by 0 FIIs
Moderate Leasing And Capital Services Ltd. (49.1%)
None
26.42%
Quarterly Results Snapshot (Standalone) - Mar'26 - QoQ

QoQ Growth in quarter ended Mar 2026 is -80.62% vs 36.92% in Dec 2025
QoQ Growth in quarter ended Mar 2026 is -79.87% vs 254.86% in Dec 2025
Half Yearly Results Snapshot (Standalone) - Sep'25
Growth in half year ended Sep 2025 is -15.73% vs 37.30% in Sep 2024
Growth in half year ended Sep 2025 is -25.05% vs 182.97% in Sep 2024
Nine Monthly Results Snapshot (Standalone) - Dec'25
YoY Growth in nine months ended Dec 2025 is 3.46% vs 14.76% in Dec 2024
YoY Growth in nine months ended Dec 2025 is 43.04% vs 138.64% in Dec 2024
Annual Results Snapshot (Standalone) - Mar'26
YoY Growth in year ended Mar 2026 is -23.15% vs 19.79% in Mar 2025
YoY Growth in year ended Mar 2026 is 8.95% vs 39.65% in Mar 2025
About Bihar Sponge Iron Ltd

Company Coordinates


