
Key Events This Week
29 Jun: Technical momentum shifts amid mixed market signals
30 Jun: Downgrade to Sell rating amid weak fundamentals and mixed technicals
03 Jul: Week closes at Rs.54.98 (+0.44%)
Jul 10, 03:30 PM
BSE+NSE Vol: 2.95 lacs
Construction
INR 1,206 Cr (Micro Cap)
816.00
38
0.00%
0.49
0.29%
2.23
Latest dividend: 0.05 per share ex-dividend date: Sep-12-2013

29 Jun: Technical momentum shifts amid mixed market signals
30 Jun: Downgrade to Sell rating amid weak fundamentals and mixed technicals
03 Jul: Week closes at Rs.54.98 (+0.44%)
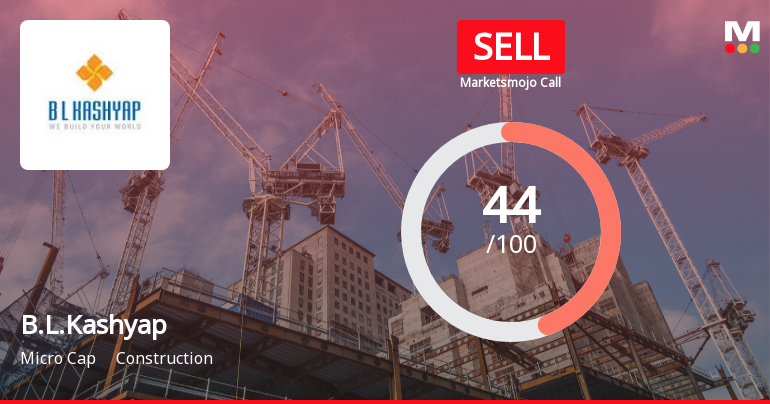
B.L.Kashyap & Sons Ltd, a micro-cap player in the construction sector, has seen its investment rating downgraded from Hold to Sell as of 29 June 2026. This change reflects a combination of deteriorating technical indicators, flat financial performance, and weak long-term fundamentals, despite some attractive valuation metrics. The company’s Mojo Score now stands at 44.0, signalling caution for investors amid a challenging market environment.
Read full news article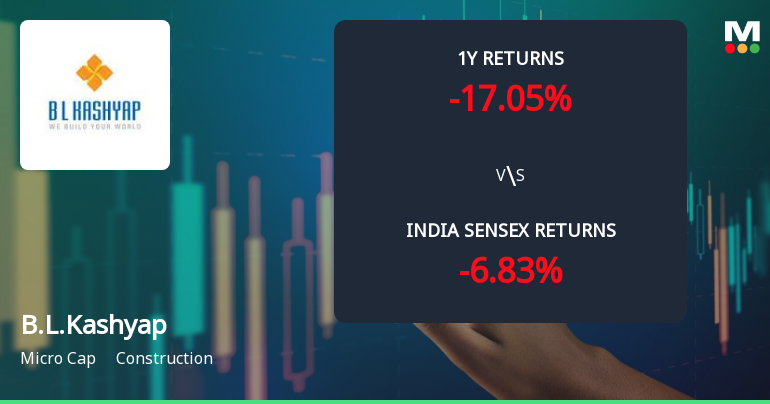
B.L.Kashyap & Sons Ltd, a micro-cap player in the construction sector, has experienced a notable shift in its technical momentum, moving from a bullish to a mildly bullish stance. Despite a recent day decline of 4.07%, the stock’s technical indicators present a complex picture with weekly signals largely positive but monthly trends showing caution. This article analyses the evolving technical parameters, price momentum, and relative performance against the Sensex to provide a comprehensive outlook for investors.
Read full news articleB. L. Kashyap and Sons Limited has submitted to the Exchange a copy of Disclosure of Related Party Transactions for the half year ended September 30, 2019 pursuant to Regulation 23(9) of the Securities and Exchange Board of India (Listing Obligations and Disclosure Requirements) Regulations, 2015.
B. L. Kashyap and Sons Limited has informed the Exchange regarding Board meeting held on November 13, 2019.
B. L. Kashyap and Sons Limited has informed the Exchange regarding a press release dated October 30, 2019, titled "Award of Projects worth of Rs. 332 Crores".

No Upcoming Board Meetings

B.L.Kashyap & Sons Ltd has declared 5% dividend, ex-date: 12 Sep 13

B.L.Kashyap & Sons Ltd has announced 1:5 stock split, ex-date: 29 Sep 10

B.L.Kashyap & Sons Ltd has announced 1:1 bonus issue, ex-date: 29 Sep 10

No Rights history available
 Technical Indicator Scale: Bearish, Mildly Bearish, Sideways, Mildly Bullish, Bullish Turned
 Promoters
99.3402
Held by 0 Schemes
Held by 12 FIIs (0.29%)
Vineet Kashyap (21.77%)
Anmol Finpro Pvt (1.11%)
28.39%

YoY Growth in quarter ended Mar 2026 is 24.36% vs -9.86% in Mar 2025

YoY Growth in quarter ended Mar 2026 is -254.35% vs 7,750.00% in Mar 2025
Growth in half year ended Sep 2025 is 11.98% vs 6.60% in Sep 2024
Growth in half year ended Sep 2025 is -92.47% vs 34.99% in Sep 2024
YoY Growth in nine months ended Dec 2025 is 18.15% vs -4.86% in Dec 2024
YoY Growth in nine months ended Dec 2025 is -54.26% vs 6.51% in Dec 2024
YoY Growth in year ended Mar 2026 is 19.55% vs -7.30% in Mar 2025
YoY Growth in year ended Mar 2026 is -94.36% vs -47.69% in Mar 2025


