
Compare BLS E-Services with Similar Stocks
Dashboard
The company is Net-Debt Free
Healthy long term growth as Net Sales has grown by an annual rate of 92.55% and Operating profit at 33.55%
The company has declared Positive results for the last 9 consecutive quarters
With ROE of 11, it has a Very Expensive valuation with a 5.1 Price to Book Value
Rising Promoter Confidence
Market Beating Performance
Stock DNA
Computers - Software & Consulting
INR 2,738 Cr (Small Cap)
47.00
21
0.51%
-0.73
11.01%
5.13
Total Returns (Price + Dividend) 
Latest dividend: 0.5035232843137255 per share ex-dividend date: Feb-13-2026
Risk Adjusted Returns v/s
Returns Beta

News
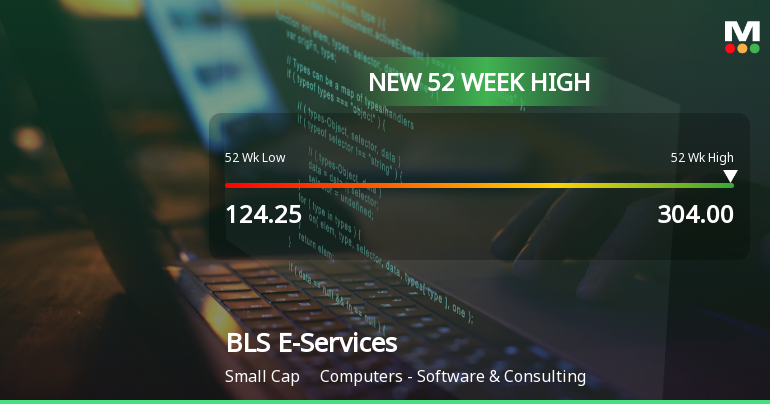
Broad-Based Technical Strength Lifts BLS E-Services Ltd to 52-Week High of Rs 304
Surging past its previous peak, BLS E-Services Ltd touched a fresh 52-week high of Rs 304 on 31 Jul 2026, marking a remarkable 64.3% gain over the past year. This milestone comes amid a backdrop of strong technical momentum and a market environment where the Sensex itself is trading near recent highs.
Read full news article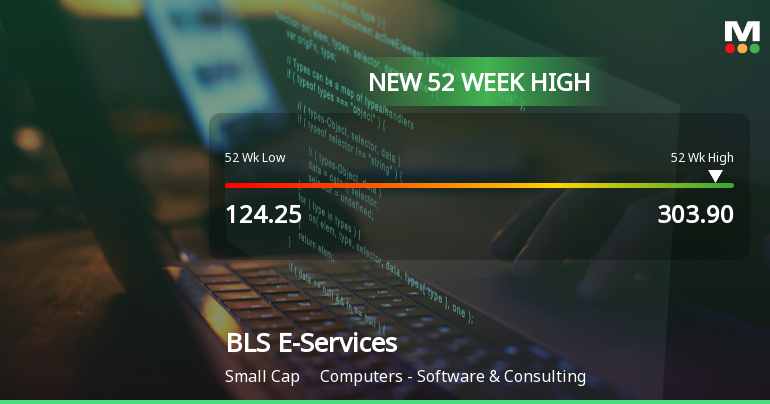
BLS E-Services Ltd Hits New 52-Week High of Rs 303.9 on Back of Strong Technical Signals
From Rs 124.25 to Rs 303.9 in the past year, BLS E-Services Ltd has surged by nearly 61%, significantly outperforming the Sensex, which declined by 4.68% over the same period. This remarkable rally culminated in the stock reaching a fresh 52-week high today, driven predominantly by a confluence of bullish technical indicators and sustained price momentum.
Read full news article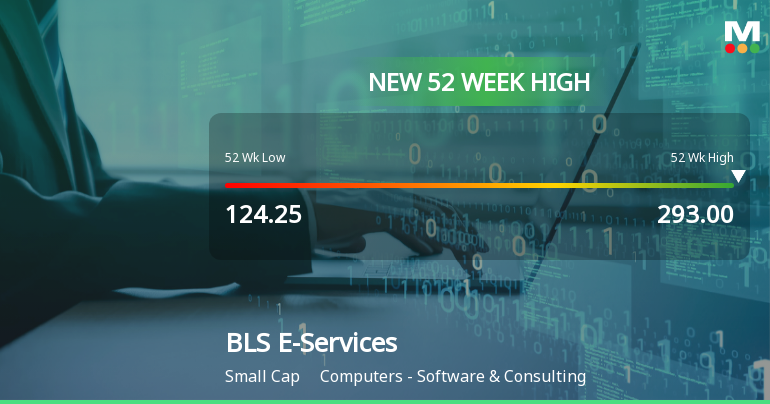
BLS E-Services Ltd Hits New 52-Week High of Rs 293.8 on Back of Strong Technical Signals
Surging past its previous peaks, BLS E-Services Ltd touched a fresh 52-week high of Rs 293.8 on 29 Jul 2026, marking a remarkable 61.98% gain over the past year against the Sensex’s decline of 4.45%. This milestone reflects a robust price momentum supported by a confluence of bullish technical indicators across multiple timeframes.
Read full news article Announcements
Corporate Actions

No Upcoming Board Meetings

BLS E-Services Ltd has declared 5% dividend, ex-date: 13 Feb 26

No Splits history available

No Bonus history available

No Rights history available
Quality key factors
Valuation key factors
Technicals key factors
 Technical Indicator Scale: Bearish, Mildly Bearish, Sideways, Mildly Bullish, Bullish Turned
 Shareholding Snapshot : Jun 2026
Shareholding Compare (%holding)
Promoters
None
Held by 0 Schemes
Held by 7 FIIs (0.64%)
Bls International Services Limited (53.89%)
Sunabh Consultancy Pvt Limited (4.55%)
15.44%
Quarterly Results Snapshot (Consolidated) - Mar'26 - QoQ

QoQ Growth in quarter ended Mar 2026 is 15.21% vs 4.05% in Dec 2025
QoQ Growth in quarter ended Mar 2026 is 16.52% vs -18.02% in Dec 2025
Half Yearly Results Snapshot (Consolidated) - Sep'25
Growth in half year ended Sep 2025 is 236.86% vs -2.35% in Sep 2024

Growth in half year ended Sep 2025 is 14.49% vs 92.96% in Sep 2024
Nine Monthly Results Snapshot (Consolidated) - Dec'25
YoY Growth in nine months ended Dec 2025 is 183.58% vs 22.96% in Dec 2024
YoY Growth in nine months ended Dec 2025 is 8.61% vs 86.68% in Dec 2024
Annual Results Snapshot (Consolidated) - Mar'26
YoY Growth in year ended Mar 2026 is 115.23% vs 72.27% in Mar 2025
YoY Growth in year ended Mar 2026 is 9.40% vs 67.39% in Mar 2025
About BLS E-Services Ltd

Company Coordinates


