
Compare Expleo Solutions with Similar Stocks
Dashboard
Despite the size of the company, domestic mutual funds hold only 0% of the company
- Domestic mutual funds have capability to do in-depth on-the-ground research on companies- their small stake may signify either they are not comfortable at the price or the business
Consistent Underperformance against the benchmark over the last 3 years
Stock DNA
Computers - Software & Consulting
INR 1,426 Cr (Micro Cap)
11.00
21
0.00%
-0.47
17.25%
1.85
Total Returns (Price + Dividend) 
Latest dividend: 50 per share ex-dividend date: Feb-12-2025
Risk Adjusted Returns v/s
Returns Beta

News
Has Expleo Solutions Ltd declared dividend?
Expleo Solutions Ltd has declared a dividend. Dividend Details: - Percentage announced: 1100% - Amount per share: 50 - Ex-date: 31 Jul 26 Dividend Yield: 0% Total Returns by Period: In the 3-month period, the price return was 11.34%, the dividend return was 13.32%, resulting in a total return of 24.66%. In the 6-month period, the price return was -0.24%, the dividend return was 12.33%, leading to a total return of 12.09%. Over the 1-year period, the price return was -26.65%, the dividend return was 9.34%, culminating in a total return of -17.31%. For the 2-year period, the price return was -30.03%, the dividend return was 12.36%, resulting in a total return of -17.67%. In the 3-year period, the price return was -42.85%, the dividend return was 11.71%, leading to a total return of -31.14%. During the 4-year period, the price return was -30.48%, the dividend return was 12.33%, culminating in a total r...
Read full news article
Expleo Solutions Ltd Downgraded to Sell Amid Mixed Financials and Valuation Shifts
Expleo Solutions Ltd, a micro-cap player in the Computers - Software & Consulting sector, has seen its investment rating downgraded from Hold to Sell as of 29 July 2026. This shift reflects a nuanced reassessment across four key parameters: quality, valuation, financial trend, and technicals. Despite some positive financial metrics and an attractive valuation profile, concerns over consistent underperformance and limited institutional interest have weighed heavily on the outlook.
Read full news article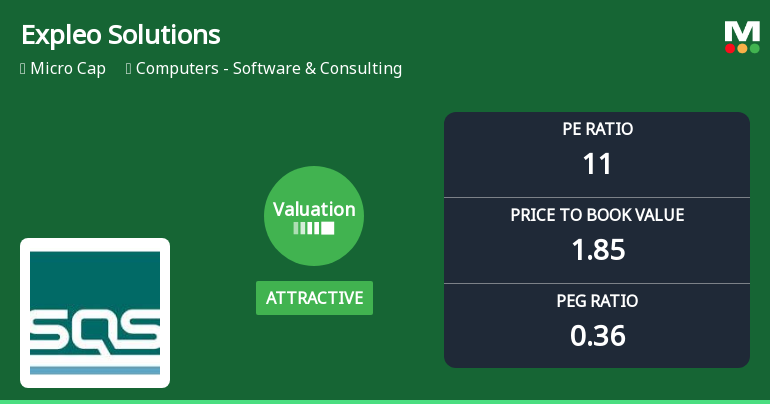
Expleo Solutions Ltd Valuation Shifts Signal Renewed Price Attractiveness
Expleo Solutions Ltd has witnessed a notable shift in its valuation parameters, moving from a very attractive to an attractive grade, reflecting a renewed price appeal amid a volatile market backdrop. Despite a challenging longer-term performance relative to the Sensex, recent valuation metrics suggest potential opportunities for investors seeking value in the Computers - Software & Consulting sector.
Read full news article Announcements
Expleo Solutions Limited - Other General Purpose
28-Nov-2019 | Source : NSEExpleo Solutions Limited has informed the Exchange regarding disclosure of Related Party Transactions, on a consolidated basis, drawn in accordance with applicable accounting standards for the period ended September 30, 2019 in compliance with Regulation 23(9) of Securities and Exchange Board of India (Listing Obligations and Disclosure Requirements) Regulations, 2015.
Expleo Solutions Limited - Press Release
01-Nov-2019 | Source : NSEExpleo Solutions Limited has informed the Exchange regarding a press release dated October 31, 2019, titled "Q2FY20 Revenue up by 9.7% Q-o-Q to Rs 657 million".
Expleo Solutions Limited - Outcome of Board Meeting
31-Oct-2019 | Source : NSEExpleo Solutions Limited has informed the Exchange regarding Board meeting held on October 31, 2019.
Corporate Actions

No Upcoming Board Meetings

Expleo Solutions Ltd has declared 1100% dividend, ex-date: 31 Jul 26

No Splits history available

No Bonus history available

No Rights history available
Quality key factors
Valuation key factors
Technicals key factors
 Technical Indicator Scale: Bearish, Mildly Bearish, Sideways, Mildly Bullish, Bullish Turned
 Shareholding Snapshot : Jun 2026
Shareholding Compare (%holding)
Promoters
None
Held by 0 Schemes
Held by 12 FIIs (0.13%)
Expleo Technology Germany Gmbh (71.05%)
None
23.57%
Quarterly Results Snapshot (Consolidated) - Mar'26 - QoQ

QoQ Growth in quarter ended Mar 2026 is 2.48% vs -1.19% in Dec 2025
QoQ Growth in quarter ended Mar 2026 is 88.30% vs -44.34% in Dec 2025
Half Yearly Results Snapshot (Consolidated) - Sep'25

Growth in half year ended Sep 2025 is 6.05% vs 11.36% in Sep 2024
Growth in half year ended Sep 2025 is 1.33% vs 59.27% in Sep 2024
Nine Monthly Results Snapshot (Consolidated) - Dec'25
YoY Growth in nine months ended Dec 2025 is 6.85% vs 8.39% in Dec 2024
YoY Growth in nine months ended Dec 2025 is 3.97% vs 10.99% in Dec 2024
Annual Results Snapshot (Consolidated) - Mar'26
YoY Growth in year ended Mar 2026 is 8.11% vs 6.21% in Mar 2025
YoY Growth in year ended Mar 2026 is 20.09% vs 14.15% in Mar 2025
About Expleo Solutions Ltd

Company Coordinates


