
Compare BLS Internat. with Similar Stocks
Dashboard
The company is Net-Debt Free
Healthy long term growth as Net Sales has grown by an annual rate of 44.35% and Operating profit at 88.79%
The company has declared Positive results for the last 20 consecutive quarters
With ROE of 27.9, it has a Very Attractive valuation with a 4.3 Price to Book Value
Despite the size of the company, domestic mutual funds hold only 1.4% of the company
Below par performance in long term as well as near term
Stock DNA
Tour, Travel Related Services
INR 10,594 Cr (Small Cap)
16.00
32
1.14%
-0.44
27.88%
4.41
Total Returns (Price + Dividend) 
Latest dividend: 2 per share ex-dividend date: Feb-13-2026
Risk Adjusted Returns v/s
Returns Beta

News

BLS International Services Ltd Upgraded to Hold on Valuation and Financial Strength
BLS International Services Ltd has seen its investment rating upgraded from Sell to Hold, driven primarily by a significant improvement in its valuation metrics and sustained financial performance. The company’s very attractive valuation, robust return ratios, and positive quarterly results have contributed to this reassessment, despite recent underperformance relative to the broader market.
Read full news article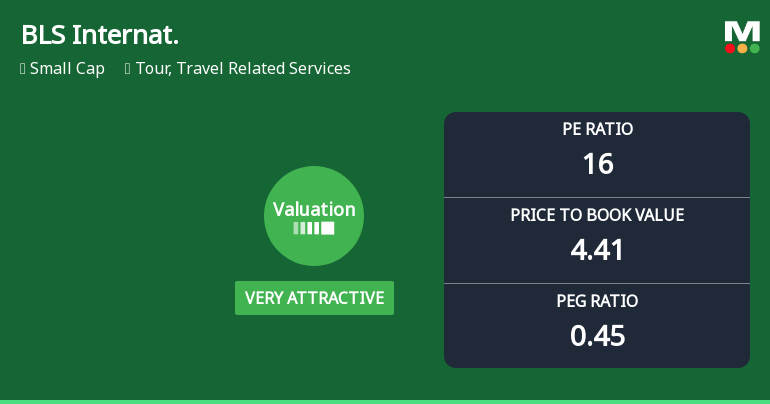
BLS International Services Ltd Valuation Shifts to Very Attractive Amid Market Challenges
BLS International Services Ltd has witnessed a significant improvement in its valuation parameters, shifting from an attractive to a very attractive rating. This change, coupled with robust return metrics and a favourable price-to-earnings ratio, has caught the attention of investors seeking value in the tour and travel related services sector.
Read full news article
BLS International Services Ltd Downgraded to Sell Amid Mixed Financial and Technical Signals
BLS International Services Ltd, a small-cap player in the Tour and Travel Related Services sector, has seen its investment rating downgraded from Hold to Sell by MarketsMOJO as of 16 June 2026. This revision reflects a combination of deteriorating technical indicators, a shift in valuation assessment, and mixed financial trends despite the company’s strong long-term growth metrics.
Read full news article Announcements
Announcement under Regulation 30 (LODR)-Newspaper Publication
12-Jun-2026 | Source : BSEPublic Notice for completion of dispatch of Notice of Postal Ballot of the Company
Shareholder Meeting / Postal Ballot-Notice of Postal Ballot
11-Jun-2026 | Source : BSEDear Sir / Madam Pursuant to Regulation 30 of the Securities and Exchange Board of India (Listing Obligations and Disclosure Requirements) Regulations 2015 (the Listing Regulations) we wish to inform that the Board of Directors at their meeting held on Tuesday May 19 2026 had approved the Postal Ballot Notice for seeking approval of the Members of the Company.
Announcement under Regulation 30 (LODR)-Change in Management
01-Jun-2026 | Source : BSEIn compliance with the provisions of Regulation 30 of the SEBI (LODR) Regulations 2015 we wish to inform you that Mr. Ajit Hugh Dias Chief Human Resource Officer and designated Senior Management Personnel of the Company has tendered his resignation from the services of the Company vide letter dated May 01 2026 due to personal reason. His resignation will be effective from the closing of business hours on Friday June 05 2026.
Corporate Actions

No Upcoming Board Meetings

BLS International Services Ltd has declared 200% dividend, ex-date: 13 Feb 26

BLS International Services Ltd has announced 1:10 stock split, ex-date: 26 Apr 17

BLS International Services Ltd has announced 1:1 bonus issue, ex-date: 08 Dec 22

No Rights history available
Quality key factors
Valuation key factors
Technicals key factors
 Technical Indicator Scale: Bearish, Mildly Bearish, Sideways, Mildly Bullish, Bullish Turned
 Shareholding Snapshot : Mar 2026
Shareholding Compare (%holding)
Promoters
0.0035
Held by 18 Schemes (0.41%)
Held by 107 FIIs (6.14%)
Diwakar Aggarwal (5.76%)
Life Insurance Corporation Of India (2.23%)
15.83%
Quarterly Results Snapshot (Consolidated) - Mar'26 - YoY

YoY Growth in quarter ended Mar 2026 is 17.58% vs 54.74% in Mar 2025
YoY Growth in quarter ended Mar 2026 is 31.57% vs 67.34% in Mar 2025
Half Yearly Results Snapshot (Consolidated) - Sep'25

Growth in half year ended Sep 2025 is 46.52% vs 24.83% in Sep 2024
Growth in half year ended Sep 2025 is 37.16% vs 70.95% in Sep 2024
Nine Monthly Results Snapshot (Consolidated) - Dec'25
YoY Growth in nine months ended Dec 2025 is 45.53% vs 22.08% in Dec 2024
YoY Growth in nine months ended Dec 2025 is 36.40% vs 60.67% in Dec 2024
Annual Results Snapshot (Consolidated) - Mar'26
YoY Growth in year ended Mar 2026 is 36.70% vs 30.80% in Mar 2025
YoY Growth in year ended Mar 2026 is 35.12% vs 62.39% in Mar 2025
About BLS International Services Ltd

Company Coordinates


