
Compare Bluestone Jewel with Similar Stocks
Dashboard
Weak Long Term Fundamental Strength with an average Return on Capital Employed (ROCE) of 0%
- Low ability to service debt as the company has a high Debt to EBITDA ratio of 4.97 times
With ROCE of 5.8, it has a Very Expensive valuation with a 3.3 Enterprise value to Capital Employed
98.8% of Promoter Shares are Pledged
Stock DNA
Gems, Jewellery And Watches
INR 9,296 Cr (Small Cap)
618.00
52
0.00%
0.78
1.43%
5.04
Total Returns (Price + Dividend) 
Bluestone Jewel for the last several years.
Risk Adjusted Returns v/s
Returns Beta

News
When is the next results date for Bluestone Jewellery & Lifestyle Ltd?
The next results date for Bluestone Jewellery & Lifestyle Ltd is scheduled for July 20, 2026....
Read full news article
Bluestone Jewellery & Lifestyle Ltd is Rated Sell
Bluestone Jewellery & Lifestyle Ltd is rated 'Sell' by MarketsMOJO, with this rating last updated on 05 May 2026. However, the analysis and financial metrics discussed here reflect the stock's current position as of 11 July 2026, providing investors with an up-to-date view of its fundamentals, valuation, financial trends, and technical outlook.
Read full news article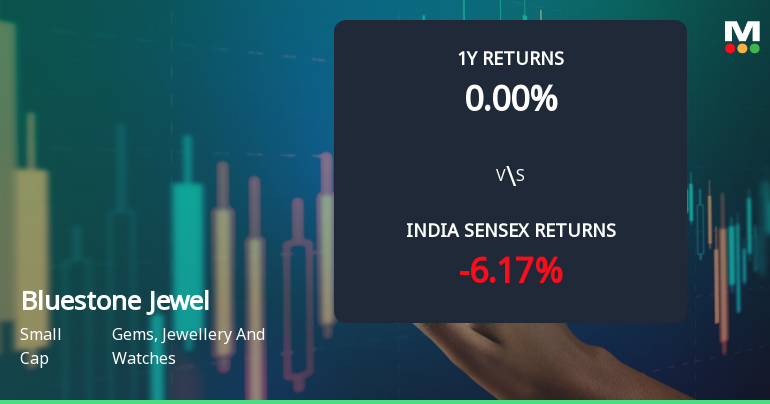
Bluestone Jewellery & Lifestyle Ltd Technical Momentum Shifts Amid Mixed Indicators
Bluestone Jewellery & Lifestyle Ltd has exhibited a notable shift in its technical momentum, moving from a sideways trend to a mildly bullish stance. This change is underscored by mixed signals from key technical indicators such as MACD, RSI, and moving averages, reflecting a nuanced outlook for investors in the gems, jewellery and watches sector.
Read full news article Announcements
Compliances-Certificate under Reg. 74 (5) of SEBI (DP) Regulations 2018
16-Jul-2026 | Source : BSECompliances Certificate under Regulation 74 (5) of SEBI DP Regulations 2018
Announcement under Regulation 30 (LODR)-Analyst / Investor Meet - Intimation
14-Jul-2026 | Source : BSEConference Call to discuss the Q1_FY27 results of the Company.
Board Meeting Intimation for Notice Of Board Meeting Pursuant To Regulation 29 Of The SEBI (Listing Obligations And Disclosure Requirements) Regulations 2015.
13-Jul-2026 | Source : BSEBluestone Jewellery And Lifestyle Ltdhas informed BSE that the meeting of the Board of Directors of the Company is scheduled on 20/07/2026 inter alia to consider and approve the standalone as well as the consolidated Un-audited financial Statements of the Company for the quarter ended on June 30 2026.
Corporate Actions

20 Jul 2026

No Dividend history available

No Splits history available

No Bonus history available

No Rights history available
Quality key factors
Valuation key factors
Technicals key factors
 Technical Indicator Scale: Bearish, Mildly Bearish, Sideways, Mildly Bullish, Bullish Turned
 Shareholding Snapshot : Mar 2026
Shareholding Compare (%holding)
FIIs
98.8012
Held by 9 Schemes (6.11%)
Held by 40 FIIs (34.19%)
Gaurav Singh Kushwaha (16.07%)
Accel India Iii (mauritius) Ltd (8.73%)
12.64%
Quarterly Results Snapshot (Standalone) - Mar'26 - QoQ

QoQ Growth in quarter ended Mar 2026 is -8.05% vs 45.76% in Dec 2025
QoQ Growth in quarter ended Mar 2026 is -49.01% vs 245.51% in Dec 2025
Half Yearly Results Snapshot (Standalone) - Sep'25
Not Applicable: The company has declared_date for only one period
Not Applicable: The company has declared_date for only one period
Nine Monthly Results Snapshot (Standalone) - Dec'25
Not Applicable: The company has declared_date for only one period
Not Applicable: The company has declared_date for only one period
Annual Results Snapshot (Standalone) - Mar'26
YoY Growth in year ended Mar 2026 is 37.92% vs 39.83% in Mar 2025

YoY Growth in year ended Mar 2026 is 111.86% vs -54.11% in Mar 2025
About Bluestone Jewellery & Lifestyle Ltd

Company Coordinates


