BN Agrochem

  • Market Cap: Small Cap
  • Industry: Trading & Distributors
  • ISIN: INE00HZ01011
  • NSEID: BNAGROCHEM
  • BSEID: 526125
INR
289.50
3.6 (1.26%)
BSENSE

Jun 15, 03:40 PM

BSE+NSE Vol: 1.11 lacs

  • Price Points
  • Score
  • Mojo Parameters
  • Total Return
  • News and Corporate Actions
  • Key factors
  • Shareholding
  • Financials
  • CompanyCV
stock-summaryPrice Point
High/Low

1Day

52 Week

Valuation
Technical
Day's Volume

CASH

1.11 lacs (4,583.02%) Volume

Shareholding (Mar 2026)

FII

0.00%

Held by 1 FIIs

DII

0.00%

Held by 0 DIIs

Promoter

5.93%

Why is BN Agrochem Ltd falling/rising?

15-Jun-2026

As of 14-Jun, BN Agrochem Ltd's stock price is rising to 285.90, reflecting a 1.74% increase. This growth is driven by strong financial performance, including six consecutive quarters of profit growth, despite high volatility and decreased investor participation.

As of 14-Jun, BN Agrochem Ltd's stock price is rising, currently at 285.90, reflecting a change of 4.9 (1.74%) upwards. This increase can be attributed to several factors. Notably, the stock has been gaining for the last three days, with a total return of 10.52% during this period. Additionally, it has outperformed its sector by 2.22% today.<BR><BR>Despite opening with a loss of -4.27%, the stock reached an intraday high of Rs 294.8, indicating strong intraday performance. The company has also reported positive results for the last six consecutive quarters, with significant growth in profit before tax (PBT) and net sales, which reached Rs 261.36 crore. This strong financial performance has contributed to the stock's ability to generate a remarkable 59.85% return over the past year, significantly outperforming the broader market, which has seen negative returns.<BR><BR>However, it is important to note that the stock has experienced high volatility today, with an intraday volatility of 6.07%, and there has been a decline in investor participation, as evidenced by a 51.33% drop in delivery volume compared to the five-day average. Despite these mixed signals, the recent positive performance and strong quarterly results appear to be driving the stock's rise.

View full answer

What does BN Agrochem do?

11-Jun-2026

BN Agrochem Ltd manufactures and trades oil, oil seeds, and related products, operating as a Small Cap company since 1991. As of March 2026, it reported net sales of 261 Cr and a net profit of 3 Cr, with a market cap of INR 2,640 Cr.

Overview: <BR>BN Agrochem Ltd is engaged in the manufacturing and trading of various kinds of oil, oil seeds, and related products within the Trading & Distributors industry, categorized as a Small Cap company.<BR><BR>History: <BR>Established in 1991, BN Agrochem Ltd was formerly known as Arihant Tournesol Ltd. The company began its operations in the capital market in August 1993 and commenced manufacturing at its solvent extraction plant on March 30, 1995. The oil refinery was installed by March 1996. The latest reported quarterly results indicate net sales and profit for the period ending March 2026.<BR><BR>Financial Snapshot: <BR>Net Sales: 261 Cr (Quarterly Results - Mar 2026) <BR>Net Profit: 3 Cr (Quarterly Results - Mar 2026) <BR>Market Cap: INR 2,640 Cr (Small Cap)<BR><BR>Key Metrics: <BR>P/E: 79.00 <BR>Industry P/E: 22 <BR>Dividend Yield: 0.00% <BR>Debt-Equity: 0.08 <BR>Return on Equity: 7.32% <BR>Price to Book: 5.52 <BR><BR>Contact Details: <BR>Address: Plot No B-3 MIDC PH-1, In Front of Shakti Tyres Akola Maharashtra : 444001 <BR>Email: info@arihanttournesol.com <BR>Website: http://www.arihanttournesol.com

View full answer

How big is BN Agrochem?

11-Jun-2026

As of 10th June, BN Agrochem Ltd has a market capitalization of 2,640.00 Cr, with recent net sales of 873.28 Cr and a net profit of 34.17 Cr.

As of 10th June, BN Agrochem Ltd has a market capitalization of 2,640.00 Cr, categorizing it as a Small Cap company.<BR><BR>In the latest four quarters, BN Agrochem reported Net Sales of 873.28 Cr and a Net Profit of 34.17 Cr.<BR><BR>The latest annual period for the balance sheet is March 2025, with Shareholder's Funds amounting to 391.42 Cr and Total Assets of 661.98 Cr.

View full answer

Who are in the management team of BN Agrochem?

11-Jun-2026

The management team of BN Agrochem includes Anubhav Agarwal (Managing Director & CEO), Ashima Agarwal (Non-Executive Director), Rakesh Kumar Verma (Independent Director), Shalu Saraf (Independent Director), and Reetika Mahendra (Company Secretary & Compliance Officer).

The management team of BN Agrochem includes the following individuals:<BR><BR>1. **Anubhav Agarwal** - Managing Director & CEO<BR>2. **Ashima Agarwal** - Non-Executive Director<BR>3. **Rakesh Kumar Verma** - Independent Director<BR>4. **Shalu Saraf** - Independent Director<BR>5. **Reetika Mahendra** - Company Secretary & Compliance Officer<BR><BR>If you need more information about any specific member or their roles, feel free to ask!

View full answer

Who are the peers of the BN Agrochem?

11-Jun-2026

BN Agrochem's peers include Redington, MMTC, Elitecon International, MSTC, Ravindra Energy, Vintage Coffee, Arisinfra Solutions, Yamuna Syndicate, and SMT Engineering. Key insights show varying management risks, growth rates, and capital structures among these companies, with Vintage Coffee leading in 1-year returns at 32.02%.

Peers: The peers of BN Agrochem are Redington, MMTC, Elitecon Inter., MSTC, Ravindra Energy, Vintage Coffee, Arisinfra Solu., Yamuna Syndicate, and SMT Engineering.<BR><BR>Quality Snapshot: Excellent management risk is observed at Redington, while Average management risk is found at MMTC, Elitecon Inter., MSTC, and Arisinfra Solu., and the rest have Below Average management risk. Growth is Excellent at BN Agrochem, Elitecon Inter., Vintage Coffee, and SMT Engineering, while Good growth is seen at Redington and Ravindra Energy, Average growth at MSTC, and Below Average growth at MMTC and Yamuna Syndicate. Capital Structure is Excellent at MSTC and Elitecon Inter., Good at Redington and Yamuna Syndicate, Average at Vintage Coffee, and Below Average at BN Agrochem, Ravindra Energy, and Arisinfra Solu.<BR><BR>Return Snapshot: Vintage Coffee has the highest 1-year return at 32.02%, while Redington has the lowest at -18.26%, and BN Agrochem's 1-year return is not available for comparison. Additionally, peers such as Ravindra Energy, Arisinfra Solu., and BN Agrochem have negative six-month returns.

View full answer

Should I buy, sell or hold BN Agrochem Ltd?

03-Jun-2026

Are BN Agrochem Ltd latest results good or bad?

02-Jun-2026

BN Agrochem Ltd's latest results are concerning, showing a net profit decline of 84.68% year-on-year despite a 22.02% revenue growth. The low operating margin and weak return on equity indicate ongoing profitability issues, suggesting investors should proceed with caution.

The latest results for BN Agrochem Ltd indicate a challenging performance. In Q4 FY26, the company reported a net profit of ₹2.95 crores, which represents a significant decline of 84.68% year-on-year. This sharp drop in profit is concerning, especially when contrasted with a revenue growth of 22.02%, reaching ₹261.36 crores. <BR><BR>While the revenue growth is a positive sign, the company's operating margin remains very low at 1.62%, highlighting ongoing issues with profitability. Additionally, the return on equity (ROE) stands at just 2.52%, indicating weak capital efficiency. <BR><BR>Although there was a sequential recovery from a loss of ₹6.78 crores in the previous quarter (Q3 FY26), the overall trend suggests instability and operational inefficiencies that have not been adequately addressed. The volatility in financial performance, with net profit swinging dramatically over the past year, raises red flags for investors.<BR><BR>In summary, while there are some positive aspects, such as revenue growth, the significant decline in net profit and low profitability metrics suggest that the latest results are more indicative of underlying problems rather than a solid performance. Investors should approach with caution.

View full answer

Is BN Agrochem technically bullish or bearish?

04-Dec-2025

As of December 3, 2025, the trend is mildly bullish due to positive daily moving averages and supportive Bollinger Bands, though caution is advised from mixed signals in the weekly MACD and KST.

As of 3 December 2025, the technical trend has changed from sideways to mildly bullish. The current stance is mildly bullish, driven by the daily moving averages indicating bullish momentum. However, the weekly MACD and KST are mildly bearish, suggesting some caution in the short term. The Bollinger Bands are bullish on both weekly and monthly time frames, supporting the overall positive outlook. Despite the mixed signals from the MACD and KST, the strong performance in the daily moving averages and Bollinger Bands indicates a prevailing bullish trend.

View full answer

How has been the historical performance of BN Agrochem?

24-Nov-2025

BN Agrochem has shown significant growth, with net sales increasing to 299.41 Cr in March 2025 from zero in March 2023, and profitability improving with a profit after tax of 19.76 Cr, recovering from a loss the previous year. Total assets rose to 661.98 Cr, reflecting the company's expansion despite negative cash flow from operations.

Answer:<BR>The historical performance of BN Agrochem shows significant growth in net sales and profitability over the past three years.<BR><BR>Breakdown:<BR>In the fiscal year ending March 2025, BN Agrochem reported net sales of 299.41 Cr, a substantial increase from 7.09 Cr in March 2024 and from zero in March 2023. Total operating income followed a similar trend, reaching 299.41 Cr in March 2025, compared to 7.09 Cr in the previous year. The company's total expenditure, excluding depreciation, rose to 336.72 Cr in March 2025 from 10.21 Cr in March 2024, leading to an operating profit (PBDIT) of 30.51 Cr, a recovery from a loss of 3.12 Cr in March 2024. Profit before tax also improved to 21.66 Cr in March 2025, compared to a loss of 3.13 Cr the previous year, resulting in a profit after tax of 19.76 Cr, a significant turnaround from a loss of 3.13 Cr in March 2024. The company's total assets increased to 661.98 Cr in March 2025 from 72.38 Cr in March 2024, while total liabilities also rose to 661.98 Cr, reflecting the company's growth. Cash flow from operating activities remained negative at -31.00 Cr, but cash flow from financing activities was positive at 328.00 Cr, contributing to a net cash inflow of 6.00 Cr by the end of March 2025.

View full answer

When is the next results date for BN Holdings?

12-Jun-2025

The next results date for BN Holdings is June 14, 2025.

The next results date for BN Holdings is scheduled for June 14, 2025.

View full answer

Is BN Holdings overvalued or undervalued?

09-Jun-2025

As of January 2, 2025, BN Holdings is rated as risky and overvalued, with alarming PE and EV to EBIT ratios of -530.88 and -532.89, respectively, and a Price to Book Value of 23.38, contrasting sharply with its peers like Gujarat Ambuja Exports Ltd. and BCL Industries Ltd., despite a 1-year stock return of 16.24% that outperformed the Sensex's 7.57%.

As of 2 January 2025, the valuation grade for BN Holdings has moved from does not qualify to risky, indicating a significant shift in its perceived financial health. The company is currently overvalued, as evidenced by its PE ratio of -530.88 and EV to EBIT of -532.89, both of which are alarming figures. Additionally, the Price to Book Value stands at 23.38, further suggesting that the stock is priced excessively compared to its book value.<BR><BR>In comparison to its peers, BN Holdings' valuation metrics starkly contrast with those of Gujarat Ambuja Exports Ltd., which has a PE ratio of 21.62 and is rated as attractive, and BCL Industries Ltd., rated very attractive with a PE of 13.08. This disparity highlights BN Holdings' overvaluation in the context of its industry. Notably, the company's recent stock performance has outpaced the Sensex, with a 1-year return of 16.24% compared to the Sensex's 7.57%, but this does not mitigate the concerns raised by its financial ratios.

View full answer

Who are the top shareholders of the BN Holdings?

06-Jun-2025

The top shareholders of BN Holdings include Anubhav Agarwal, the promoter with 5.93%, and the Global Focus Fund, the largest public shareholder at 18.34%. Individual investors hold 3.52%, and there is one foreign institutional investor with 0.02%, with no pledged promoter holdings or mutual funds involved.

The top shareholders of BN Holdings include Anubhav Agarwal, who is the promoter with the highest holding at 5.93%. The highest public shareholder is the Global Focus Fund, which holds 18.34%. Additionally, individual investors collectively hold 3.52% of the company. There is also one foreign institutional investor (FII) that holds 0.02% of the shares. Notably, there are no pledged promoter holdings or mutual funds involved in the shareholding.

View full answer

Has BN Holdings declared dividend?

06-Jun-2025

No Dividend History Available

iScoreScore
Click here to find our call on this stock
Strong Sell
Sell
Hold
Buy
Strong Buy

Dashboard

1

Weak Long Term Fundamental Strength with an average Return on Equity (ROE) of 6.57%

  • Low ability to service debt as the company has a high Debt to EBITDA ratio of 2.29 times
2

With ROE of 7.3, it has a Very Expensive valuation with a 6.1 Price to Book Value

3

Despite the size of the company, domestic mutual funds hold only 0% of the company

stock-summaryMojo Parameters

Mojo Parameters

Loading Valuation Snapshot...

Stock DNA

stock-summary
Industry

Trading & Distributors

stock-summary
Market cap

INR 2,767 Cr (Small Cap)

stock-summary
P/E

83.00

stock-summary
Industry P/E

22

stock-summary
Dividend Yield

0.00%

stock-summary
Debt Equity

0.08

stock-summary
Return on Equity

7.32%

stock-summary
Price to Book

6.10

Revenue and Profits:
Net Sales:
261 Cr
(Quarterly Results - Mar 2026)
Net Profit:
3 Cr
stock-summaryTotal Returns
Total Returns (Price + Dividend) stock-summary
Dividend Yield (0%)
TimePeriod
Price Return
Dividend Return
Total Return
3 Months
33.84%
0%
33.84%
6 Months
-25.54%
0%
-25.54%
1 Year
56.49%
0%
56.49%
2 Years
84.98%
0%
84.98%
3 Years
0%
0%
0.0%
4 Years
2280.76%
0%
2280.76%
5 Years
2893.8%
0%
2893.8%

BN Agrochem for the last several years.

Risk Adjusted Returns v/s stock-summary
Returns Beta
Icon
Beta has not been calculated since enough price history is not available
stock-summaryNews & Corporate Actions

News

BN Agrochem Ltd Falls 22.61%: 5 Key Factors Driving the Sharp Weekly Decline

Key Events This Week
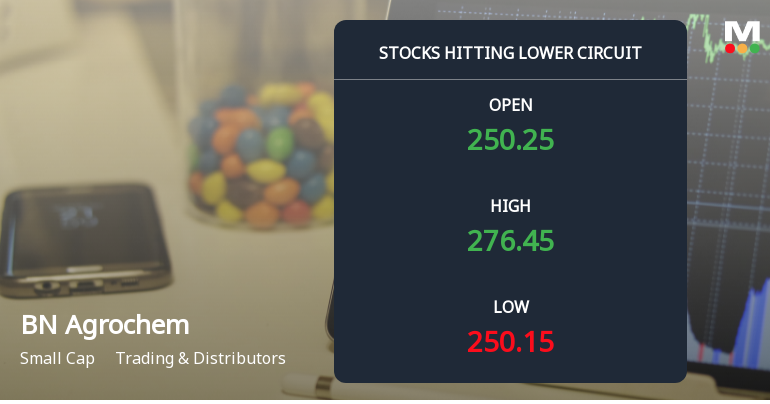
1 June: Stock hits upper circuit amid strong buying pressure

2 June: Lower circuit triggered amid heavy selling and technical momentum shift

3 June: Gap down opening and second consecutive lower circuit hit

4 June: Third consecutive lower circuit plunge amid thin volumes

5 June: Week closes at Rs.291.70, down 22.61%

BN Agrochem Ltd Declines 1.99%: 5 Key Factors Behind the Week’s Pressure

Announcements stock-summary

Announcement under Regulation 30 (LODR)-Meeting Updates

29-May-2026 | Source : BSE

Pursuant to Regulation 30 of SEBI LODR 2015 please find attached decisions taken by Board of Directors in their meeting held today.

Results- Financial Results For March 31 2026

29-May-2026 | Source : BSE

The Board of directors in their meeting held today considered and approved the financial results (Standalone and Consolidated) for the year ended March 31 2026.

Compliances-Reg.24(A)-Annual Secretarial Compliance

29-May-2026 | Source : BSE

Pursuant Regulation 24 A of SEBI (Listing Obligation and Disclosure Requirement) Regulations 2015 please find attached Annual Secretarial Compliance Report for the year ended March 31 2026.

Corporate Actions stock-summary

stock-summary
BOARD MEETING

No Upcoming Board Meetings

stock-summary
DIVIDEND

No Dividend history available

stock-summary
SPLITS

No Splits history available

stock-summary
BONUS

No Bonus history available

stock-summary
RIGHTS

No Rights history available

stock-summaryKey Factors

Quality key factors stock-summary

Factor
Value
Sales Growth (5y)
1,009.80%
EBIT Growth (5y)
197.32%
EBIT to Interest (avg)
0.68
Debt to EBITDA (avg)
Negative Net Debt
Net Debt to Equity (avg)
0.08
Sales to Capital Employed (avg)
0.60
Tax Ratio
Tax Ratio is Negative%
Dividend Payout Ratio
0
Pledged Shares
0
Institutional Holding
0.00%
ROCE (avg)
-3.22%
ROE (avg)
6.57%

Valuation key factors

Factor
Value
P/E Ratio
83
Industry P/E
22
Price to Book Value
6.10
EV to EBIT
232.79
EV to EBITDA
219.16
EV to Capital Employed
5.72
EV to Sales
3.30
PEG Ratio
1.98
Dividend Yield
NA
ROCE (Latest)
2.46%
ROE (Latest)
7.32%

Technicals key factors

Indicator
Weekly
Monthly
MACD
Mildly Bullish
Mildly Bearish
RSI
No Signal
No Signal
Bollinger Bands
Mildly Bullish
Mildly Bullish
Moving Averages
Mildly Bearish (Daily)
KST
Mildly Bullish
Mildly Bearish
Dow Theory
Mildly Bearish
Mildly Bullish
OBV
Mildly Bullish
No Trend
stock-summary Technical Indicator Scale: Bearish, Mildly Bearish, Sideways, Mildly Bullish, Bullish  Turned 
stock-summaryShareholding
Shareholding Snapshot : Mar 2026stock-summary
Shareholding Compare (%holding) stock-summary
Majority shareholders

Non Institution

Pledged Promoter Holdings

None

Mutual Funds

Held by 0 Schemes

FIIs

Held by 1 FIIs (0.0%)

Promoter with highest holding

Anubhav Agarwal (5.93%)

Highest Public shareholder

Global Focus Fund (18.34%)

Individual Investors Holdings

3.24%

stock-summaryFinancial
[
  {
    "link": "quarterly",
    "btn_text": "All Quarterly Results",
    "header": "Quarterly Results Snapshot (Consolidated) - Mar'26 - YoY",
    "rhs": [
      {
        "prefix": "Net Sales ",
        "suffix": "YoY Growth in quarter ended Mar 2026 is 22.02% vs 2,921.02% in Mar 2025",
        "dir": -1
      },
      {
        "prefix": "Consolidated Net Profit ",
        "suffix": "YoY Growth in quarter ended Mar 2026 is -84.68% vs 2,215.38% in Mar 2025",
        "dir": -1
      }
    ],
    "table": {
      "header": [
        "Mar'26",
        "Mar'25",
        "Change(%)"
      ],
      "body": [
        {
          "field": "Net Sales",
          "val1": "261.36",
          "val2": "214.19",
          "chgp": "22.02%",
          "chgp_class": "positive"
        },
        {
          "field": "Operating Profit (PBDIT) excl Other Income",
          "val1": "4.23",
          "val2": "-40.55",
          "chgp": "110.43%",
          "chgp_class": "positive"
        },
        {
          "field": "Interest",
          "val1": "0.50",
          "val2": "1.64",
          "chgp": "-69.51%",
          "chgp_class": "positive"
        },
        {
          "field": "Exceptional Items",
          "val1": "0.00",
          "val2": "0.00",
          "chgp": "",
          "chgp_class": "neutral"
        },
        {
          "field": "Consolidate Net Profit",
          "val1": "2.95",
          "val2": "19.25",
          "chgp": "-84.68%",
          "chgp_class": "negative"
        },
        {
          "field": "Operating Profit Margin (Excl OI)",
          "val1": "1.62%",
          "val2": "-18.93%",
          "chgp": "20.55%",
          "chgp_class": "positive"
        }
      ]
    }
  },
  {
    "link": "half-yearly",
    "btn_text": "All Half Yearly Results",
    "header": "Half Yearly Results Snapshot (Consolidated) - Sep'25",
    "rhs": [
      {
        "prefix": "Net Sales ",
        "suffix": " Growth in half year ended Sep 2025 is 0.00% vs 0.00% in Sep 2024",
        "dir": 0
      },
      {
        "prefix": "Consolidated Net Profit ",
        "suffix": " Growth in half year ended Sep 2025 is 599.34% vs -692.71% in Sep 2024",
        "dir": 1
      }
    ],
    "table": {
      "header": [
        "Sep'25",
        "Sep'24",
        "Change(%)"
      ],
      "body": [
        {
          "field": "Net Sales",
          "val1": "419.80",
          "val2": "0.00",
          "chgp": "",
          "chgp_class": "neutral"
        },
        {
          "field": "Operating Profit (PBDIT) excl Other Income",
          "val1": "25.08",
          "val2": "-4.58",
          "chgp": "647.60%",
          "chgp_class": "positive"
        },
        {
          "field": "Interest",
          "val1": "0.97",
          "val2": "4.13",
          "chgp": "-76.51%",
          "chgp_class": "positive"
        },
        {
          "field": "Exceptional Items",
          "val1": "0.00",
          "val2": "0.00",
          "chgp": "",
          "chgp_class": "neutral"
        },
        {
          "field": "Consolidate Net Profit",
          "val1": "38.00",
          "val2": "-7.61",
          "chgp": "599.34%",
          "chgp_class": "positive"
        },
        {
          "field": "Operating Profit Margin (Excl OI)",
          "val1": "5.97%",
          "val2": "0.00%",
          "chgp": "5.97%",
          "chgp_class": "positive"
        }
      ]
    }
  },
  {
    "link": "nine-monthly",
    "btn_text": "All Nine Monthly Results",
    "header": "Nine Monthly Results Snapshot (Consolidated) - Dec'25",
    "rhs": [
      {
        "prefix": "Net Sales ",
        "suffix": "YoY Growth in nine months ended Dec 2025 is 618.05% vs 0.00% in Dec 2024",
        "dir": 1
      },
      {
        "prefix": "Consolidated Net Profit ",
        "suffix": "YoY Growth in nine months ended Dec 2025 is 1,158.87% vs 211.71% in Dec 2024",
        "dir": 1
      }
    ],
    "table": {
      "header": [
        "Dec'25",
        "Dec'24",
        "Change(%)"
      ],
      "body": [
        {
          "field": "Net Sales",
          "val1": "611.92",
          "val2": "85.22",
          "chgp": "618.05%",
          "chgp_class": "positive"
        },
        {
          "field": "Operating Profit (PBDIT) excl Other Income",
          "val1": "8.92",
          "val2": "3.24",
          "chgp": "175.31%",
          "chgp_class": "positive"
        },
        {
          "field": "Interest",
          "val1": "1.45",
          "val2": "7.06",
          "chgp": "-79.46%",
          "chgp_class": "positive"
        },
        {
          "field": "Exceptional Items",
          "val1": "0.00",
          "val2": "0.00",
          "chgp": "",
          "chgp_class": "neutral"
        },
        {
          "field": "Consolidate Net Profit",
          "val1": "31.22",
          "val2": "2.48",
          "chgp": "1,158.87%",
          "chgp_class": "positive"
        },
        {
          "field": "Operating Profit Margin (Excl OI)",
          "val1": "1.46%",
          "val2": "3.80%",
          "chgp": "-2.34%",
          "chgp_class": "negative"
        }
      ]
    }
  },
  {
    "link": "annual",
    "btn_text": "All Annual Results",
    "header": "Annual Results Snapshot (Consolidated) - Mar'26",
    "rhs": [
      {
        "prefix": "Net Sales ",
        "suffix": "YoY Growth in year ended Mar 2026 is 191.67% vs 4,122.99% in Mar 2025",
        "dir": -1
      },
      {
        "prefix": "Consolidated Net Profit ",
        "suffix": "YoY Growth in year ended Mar 2026 is 73.94% vs 731.31% in Mar 2025",
        "dir": -1
      }
    ],
    "table": {
      "header": [
        "Mar'26",
        "Mar'25",
        "Change(%)"
      ],
      "body": [
        {
          "field": "Net Sales",
          "val1": "873.28",
          "val2": "299.41",
          "chgp": "191.67%",
          "chgp_class": "positive"
        },
        {
          "field": "Operating Profit (PBDIT) excl Other Income",
          "val1": "22.11",
          "val2": "-37.31",
          "chgp": "159.26%",
          "chgp_class": "positive"
        },
        {
          "field": "Interest",
          "val1": "1.94",
          "val2": "8.70",
          "chgp": "-77.70%",
          "chgp_class": "positive"
        },
        {
          "field": "Exceptional Items",
          "val1": "0.00",
          "val2": "0.00",
          "chgp": "",
          "chgp_class": "neutral"
        },
        {
          "field": "Consolidate Net Profit",
          "val1": "34.37",
          "val2": "19.76",
          "chgp": "73.94%",
          "chgp_class": "positive"
        },
        {
          "field": "Operating Profit Margin (Excl OI)",
          "val1": "2.53%",
          "val2": "-12.46%",
          "chgp": "14.99%",
          "chgp_class": "positive"
        }
      ]
    }
  }
]

Quarterly Results Snapshot (Consolidated) - Mar'26 - YoYstock-summary

Mar'26
Mar'25
Change(%)
Net Sales
261.36
214.19
22.02%
Operating Profit (PBDIT) excl Other Income
4.23
-40.55
110.43%
Interest
0.50
1.64
-69.51%
Exceptional Items
0.00
0.00
Consolidate Net Profit
2.95
19.25
-84.68%
Operating Profit Margin (Excl OI)
1.62%
-18.93%
20.55%
Values in Rs Cr.
Direction Arrows
Net Sales

YoY Growth in quarter ended Mar 2026 is 22.02% vs 2,921.02% in Mar 2025

Direction Arrows
Consolidated Net Profit

YoY Growth in quarter ended Mar 2026 is -84.68% vs 2,215.38% in Mar 2025

Half Yearly Results Snapshot (Consolidated) - Sep'25stock-summary

Sep'25
Sep'24
Change(%)
Net Sales
419.80
0.00
Operating Profit (PBDIT) excl Other Income
25.08
-4.58
647.60%
Interest
0.97
4.13
-76.51%
Exceptional Items
0.00
0.00
Consolidate Net Profit
38.00
-7.61
599.34%
Operating Profit Margin (Excl OI)
5.97%
0.00%
5.97%
Values in Rs Cr.
Net Sales

Growth in half year ended Sep 2025 is 0.00% vs 0.00% in Sep 2024

Direction Arrows
Consolidated Net Profit

Growth in half year ended Sep 2025 is 599.34% vs -692.71% in Sep 2024

Nine Monthly Results Snapshot (Consolidated) - Dec'25stock-summary

Dec'25
Dec'24
Change(%)
Net Sales
611.92
85.22
618.05%
Operating Profit (PBDIT) excl Other Income
8.92
3.24
175.31%
Interest
1.45
7.06
-79.46%
Exceptional Items
0.00
0.00
Consolidate Net Profit
31.22
2.48
1,158.87%
Operating Profit Margin (Excl OI)
1.46%
3.80%
-2.34%
Values in Rs Cr.
Direction Arrows
Net Sales

YoY Growth in nine months ended Dec 2025 is 618.05% vs 0.00% in Dec 2024

Direction Arrows
Consolidated Net Profit

YoY Growth in nine months ended Dec 2025 is 1,158.87% vs 211.71% in Dec 2024

Annual Results Snapshot (Consolidated) - Mar'26stock-summary

Mar'26
Mar'25
Change(%)
Net Sales
873.28
299.41
191.67%
Operating Profit (PBDIT) excl Other Income
22.11
-37.31
159.26%
Interest
1.94
8.70
-77.70%
Exceptional Items
0.00
0.00
Consolidate Net Profit
34.37
19.76
73.94%
Operating Profit Margin (Excl OI)
2.53%
-12.46%
14.99%
Values in Rs Cr.
Direction Arrows
Net Sales

YoY Growth in year ended Mar 2026 is 191.67% vs 4,122.99% in Mar 2025

Direction Arrows
Consolidated Net Profit

YoY Growth in year ended Mar 2026 is 73.94% vs 731.31% in Mar 2025

stock-summaryCompany CV
About BN Agrochem Ltd stock-summary
stock-summary
BN Agrochem Ltd
Small Cap
Trading & Distributors
BN Holdings Ltd (formerly known Arihant Tournesol Ltd) was established in 1991. The Company is presently engaged in manufacturing and trading various kinds of oil, oil seeds, solvent extraction, extracted oil cakes, refined oil. The Company tapped the capital market in Aug.'93. It commenced manufacture at its solvent extraction plant on 30 Mar.'95. The oil refinery was installed by Mar.'96. The company bagged a Rs 33-lac order for soyabean, from Germany.
Company Coordinates stock-summary
Company Details
Plot No B-3 MIDC PH-1, In Front of Shakti Tyres Akola Maharashtra : 444001
stock-summary
Tel:
stock-summary
info@arihanttournesol.com
Registrar Details
Bigshare Services Pvt Ltd , E-2 , Ansa Industrial Estate, Saki Vihar Road, Saki Naka, Andheri (E), Mumbai