
Compare Bodhi Tree with Similar Stocks
Stock DNA
Media & Entertainment
INR 115 Cr (Micro Cap)
17.00
18
0.00%
0.40
7.69%
1.36
Total Returns (Price + Dividend) 
Latest dividend: 0.04789500000000001 per share ex-dividend date: Feb-29-2024
Risk Adjusted Returns v/s
Returns Beta

News

Bodhi Tree Multimedia Ltd is Rated Sell
Bodhi Tree Multimedia Ltd is rated 'Sell' by MarketsMOJO, with this rating last updated on 02 June 2026. However, the analysis and financial metrics discussed here reflect the stock's current position as of 08 July 2026, providing investors with the latest insights into its performance and outlook.
Read full news article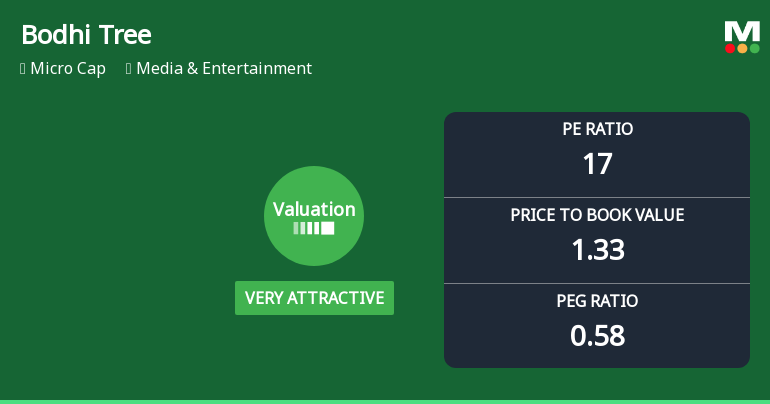
Bodhi Tree Multimedia Ltd Valuation Shifts to Very Attractive Amid Market Challenges
Bodhi Tree Multimedia Ltd has witnessed a significant improvement in its valuation parameters, shifting from an attractive to a very attractive rating. This change reflects a notable recalibration in price-to-earnings and price-to-book value metrics, positioning the micro-cap media company as a compelling consideration within the Media & Entertainment sector despite recent underperformance against broader market indices.
Read full news article
Bodhi Tree Multimedia Ltd is Rated Sell
Bodhi Tree Multimedia Ltd is rated 'Sell' by MarketsMOJO, with this rating last updated on 02 June 2026. However, the analysis and financial metrics presented here reflect the stock's current position as of 27 June 2026, providing investors with the most up-to-date view of the company’s fundamentals, returns, and market performance.
Read full news article Announcements
Compliances-Reg.24(A)-Annual Secretarial Compliance
16-Jul-2026 | Source : BSERevised Submission of Secretarial Compliance Report for the year ended march 312024 under Regulation 24A of the SEBI(LODR) Regulations 2015
Announcement under Regulation 30 (LODR)-Press Release / Media Release
14-Jul-2026 | Source : BSEPress Release Pursuant to Regulation 30 of SEBI (LODR) Regulations 2015
Compliances-Certificate under Reg. 74 (5) of SEBI (DP) Regulations 2018
10-Jul-2026 | Source : BSECertificate under Regulation 74(5) of the SEBI (Depositories and Participants) Regulations 2018 for the quarter ended june 30 2026
Corporate Actions

No Upcoming Board Meetings

Bodhi Tree Multimedia Ltd has declared 5% dividend, ex-date: 29 Feb 24

Bodhi Tree Multimedia Ltd has announced 1:10 stock split, ex-date: 05 Apr 24

Bodhi Tree Multimedia Ltd has announced 4:1 bonus issue, ex-date: 23 Sep 22

Bodhi Tree Multimedia Ltd has announced 4:9 rights issue, ex-date: 24 Mar 25
Quality key factors
Valuation key factors
Technicals key factors
 Technical Indicator Scale: Bearish, Mildly Bearish, Sideways, Mildly Bullish, Bullish Turned
 Shareholding Snapshot : Mar 2026
Shareholding Compare (%holding)
Non Institution
55.8686
Held by 0 Schemes
Held by 1 FIIs (0.39%)
Mautik Ajit Tolia (24.21%)
Augmenta Value Trust - Scheme 1 (9.31%)
42.02%
Quarterly Results Snapshot (Consolidated) - Mar'26 - QoQ

QoQ Growth in quarter ended Mar 2026 is -10.40% vs 66.75% in Dec 2025

QoQ Growth in quarter ended Mar 2026 is 28.97% vs -44.87% in Dec 2025
Half Yearly Results Snapshot (Consolidated) - Sep'25
Growth in half year ended Sep 2025 is 29.67% vs 9.54% in Sep 2024
Growth in half year ended Sep 2025 is 146.77% vs -37.69% in Sep 2024
Nine Monthly Results Snapshot (Consolidated) - Dec'25
YoY Growth in nine months ended Dec 2025 is 64.74% vs 16.05% in Dec 2024
YoY Growth in nine months ended Dec 2025 is 68.91% vs 48.33% in Dec 2024
Annual Results Snapshot (Consolidated) - Mar'26
YoY Growth in year ended Mar 2026 is 29.63% vs 39.22% in Mar 2025
YoY Growth in year ended Mar 2026 is 30.74% vs 43.95% in Mar 2025
About Bodhi Tree Multimedia Ltd

Company Coordinates


