
Compare Bombay Dyeing with Similar Stocks
Dashboard
With a Operating Losses, the company has a Weak Long Term Fundamental Strength
- Company's ability to service its debt is weak with a poor EBIT to Interest (avg) ratio of -2.01
- The company has been able to generate a Return on Equity (avg) of 0.55% signifying low profitability per unit of shareholders funds
Flat results in Mar 26
Risky - Negative EBITDA
Despite the size of the company, domestic mutual funds hold only 0% of the company
Underperformed the market in the last 1 year
Stock DNA
Garments & Apparels
INR 2,591 Cr (Small Cap)
94.00
92
0.98%
-0.41
1.23%
1.11
Total Returns (Price + Dividend) 
Latest dividend: 1.2 per share ex-dividend date: Aug-06-2025
Risk Adjusted Returns v/s
Returns Beta

News
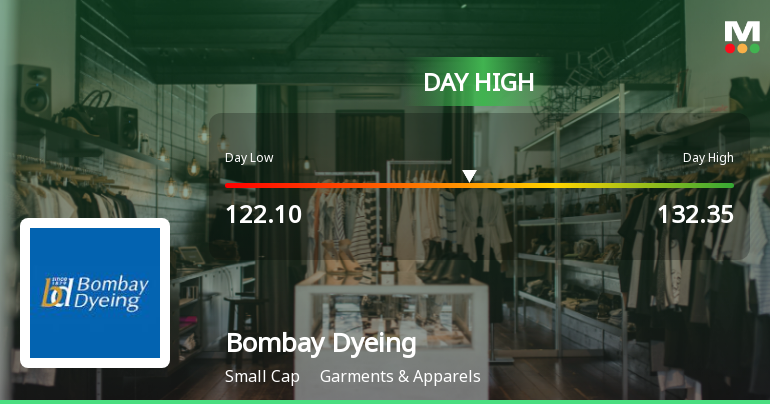
Bombay Dyeing & Manufacturing Company Ltd Surges 7.41% to Day's High of Rs 132.35 — Outperforms Sector by 8.34 Percentage Points
The Sensex declined by 0.89% on 8 Jun 2026, yet Bombay Dyeing & Manufacturing Company Ltd surged 7.41%, outperforming its Garments & Apparels sector by 8.34 percentage points. This sharp single-session gain stands out as a stock-specific event amid a broadly weak market environment.
Read full news article
Bombay Dyeing & Manufacturing Company Ltd is Rated Strong Sell
Bombay Dyeing & Manufacturing Company Ltd is rated Strong Sell by MarketsMOJO. This rating was last updated on 01 September 2025. However, the analysis and financial metrics discussed below reflect the stock’s current position as of 03 June 2026, providing investors with an up-to-date view of the company’s fundamentals, returns, and overall outlook.
Read full news article
Bombay Dyeing & Manufacturing Company Ltd is Rated Strong Sell
Bombay Dyeing & Manufacturing Company Ltd is rated Strong Sell by MarketsMOJO. This rating was last updated on 01 Sep 2025. However, the analysis and financial metrics discussed below reflect the stock’s current position as of 23 May 2026, providing investors with an up-to-date view of the company’s fundamentals, returns, and market standing.
Read full news article Announcements
Announcement under Regulation 30 (LODR)-Newspaper Publication
10-Jun-2026 | Source : BSENewspaper clippings
Announcement under Regulation 30 (LODR)-Newspaper Publication
21-May-2026 | Source : BSESubmission of Newspaper Advertisement for the Notice of Special Window for re-lodgement of transfer request of physical shares and Second 100 Days Campaign - Saksham Niveshak
Compliances-Reg.24(A)-Annual Secretarial Compliance
15-May-2026 | Source : BSEPlease find enclosed the Annual Secretarial Compliane Report of the Company for the year ended March 31 2026.
Corporate Actions

No Upcoming Board Meetings

Bombay Dyeing & Manufacturing Company Ltd has declared 20% dividend, ex-date: 31 Jul 26

Bombay Dyeing & Manufacturing Company Ltd has announced 2:10 stock split, ex-date: 30 Oct 12

No Bonus history available

No Rights history available
Quality key factors
Valuation key factors
Technicals key factors
 Technical Indicator Scale: Bearish, Mildly Bearish, Sideways, Mildly Bullish, Bullish Turned
 Shareholding Snapshot : Mar 2026
Shareholding Compare (%holding)
Promoters
None
Held by 2 Schemes (0.0%)
Held by 34 FIIs (1.04%)
Baymanco Investments Limited (28.79%)
Madhuri Madhusudan Kela (1.52%)
35.73%
Quarterly Results Snapshot (Consolidated) - Mar'26 - QoQ

QoQ Growth in quarter ended Mar 2026 is 22.17% vs -10.65% in Dec 2025
QoQ Growth in quarter ended Mar 2026 is 313.60% vs -613.02% in Dec 2025
Half Yearly Results Snapshot (Consolidated) - Sep'25
Growth in half year ended Sep 2025 is -10.96% vs -11.40% in Sep 2024

Growth in half year ended Sep 2025 is -96.15% vs 337.81% in Sep 2024
Nine Monthly Results Snapshot (Consolidated) - Dec'25
YoY Growth in nine months ended Dec 2025 is -14.60% vs -4.70% in Dec 2024
YoY Growth in nine months ended Dec 2025 is -98.77% vs -83.39% in Dec 2024
Annual Results Snapshot (Consolidated) - Mar'26
YoY Growth in year ended Mar 2026 is -9.04% vs -4.92% in Mar 2025
YoY Growth in year ended Mar 2026 is -94.51% vs -83.38% in Mar 2025
About Bombay Dyeing & Manufacturing Company Ltd

Company Coordinates


