
Compare BPL with Similar Stocks
Dashboard
With a Operating Losses, the company has a Weak Long Term Fundamental Strength
- The company has been able to generate a Return on Equity (avg) of 8.59% signifying low profitability per unit of shareholders funds
The company has declared Negative results for the last 3 consecutive quarters
Risky - Negative EBITDA
79.61% of Promoter Shares are Pledged
Below par performance in long term as well as near term
Stock DNA
Electronics & Appliances
INR 252 Cr (Micro Cap)
NA (Loss Making)
91
0.00%
0.43
-3.55%
1.05
Total Returns (Price + Dividend) 
BPL for the last several years.
Risk Adjusted Returns v/s
Returns Beta

News

BPL Ltd is Rated Strong Sell by MarketsMOJO
BPL Ltd is rated Strong Sell by MarketsMOJO, with this rating last updated on 16 February 2026. However, the analysis and financial metrics presented here reflect the company’s current position as of 11 June 2026, providing investors with the latest insights into the stock’s performance and outlook.
Read full news article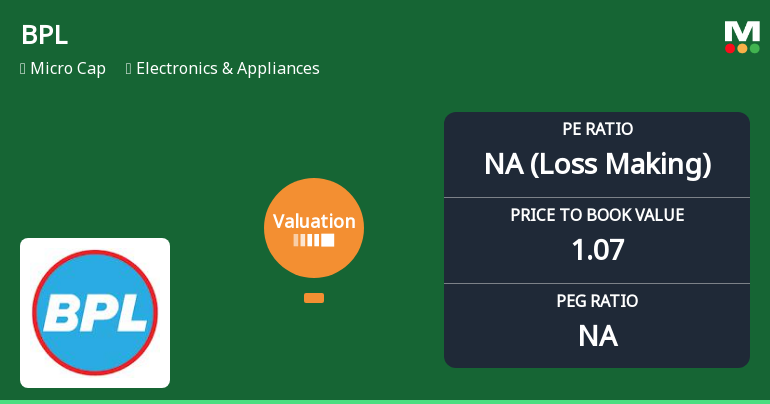
BPL Ltd Valuation Shifts Signal Elevated Risk Amid Market Challenges
BPL Ltd, a micro-cap player in the Electronics & Appliances sector, has witnessed a marked deterioration in its valuation parameters, shifting from very attractive to risky territory. This change, coupled with a recent downgrade to a Strong Sell rating, underscores growing investor concerns amid volatile price movements and challenging financial metrics.
Read full news articleAre BPL Ltd latest results good or bad?
BPL Ltd's latest financial results for Q4 FY26 present a challenging picture for the company. The net sales for the quarter amounted to ₹19.62 crores, reflecting a year-on-year growth of 4.70%. This growth, however, is modest compared to previous periods, indicating a slowdown in revenue expansion. In stark contrast, the company reported a net loss of ₹11.27 crores, a significant decline from a profit of ₹0.17 crores in the previous quarter. This marks a substantial reversal in profitability, highlighting severe operational challenges. The operating margin plummeted to -46.08%, the lowest on record, demonstrating significant inefficiencies and cost pressures that the company has been unable to manage effectively. The return on equity (ROE) stands at 10.45%, which, while positive, is below industry averages and suggests poor capital deployment. Additionally, the return on capital employed (ROCE) is alarmi...
Read full news article Announcements
Compliances-Reg.24(A)-Annual Secretarial Compliance
30-May-2026 | Source : BSEASCR 2026
Announcement under Regulation 30 (LODR)-Newspaper Publication
30-May-2026 | Source : BSECopy of Newspaper publication
Board Meeting Outcome for Outcome Of BM
28-May-2026 | Source : BSEOutcome of Board meeting
Corporate Actions

No Upcoming Board Meetings

No Dividend history available

No Splits history available

No Bonus history available

No Rights history available
Quality key factors
Valuation key factors
Technicals key factors
 Technical Indicator Scale: Bearish, Mildly Bearish, Sideways, Mildly Bullish, Bullish Turned
 Shareholding Snapshot : Mar 2026
Shareholding Compare (%holding)
Promoters
79.6057
Held by 6 Schemes (0.0%)
Held by 7 FIIs (0.03%)
Electro Investment (48.21%)
None
32.75%
Quarterly Results Snapshot (Consolidated) - Mar'26 - YoY

YoY Growth in quarter ended Mar 2026 is 4.70% vs 15.82% in Mar 2025

YoY Growth in quarter ended Mar 2026 is 36.18% vs -5,796.77% in Mar 2025
Half Yearly Results Snapshot (Consolidated) - Sep'25
Growth in half year ended Sep 2025 is -2.43% vs 12.13% in Sep 2024
Growth in half year ended Sep 2025 is -85.44% vs 41.44% in Sep 2024
Nine Monthly Results Snapshot (Consolidated) - Dec'25
YoY Growth in nine months ended Dec 2025 is -1.86% vs 18.39% in Dec 2024
YoY Growth in nine months ended Dec 2025 is -84.73% vs 28.72% in Dec 2024
Annual Results Snapshot (Consolidated) - Mar'26
YoY Growth in year ended Mar 2026 is -0.31% vs 17.96% in Mar 2025
YoY Growth in year ended Mar 2026 is -9,600.00% vs -99.33% in Mar 2025
About BPL Ltd

Company Coordinates


