
Compare Brahmaputra Inf. with Similar Stocks
Dashboard
Healthy long term growth as Operating profit has grown by an annual rate 31.41%
The company has declared Positive results for the last 5 consecutive quarters
With ROCE of 19, it has a Very Attractive valuation with a 1.2 Enterprise value to Capital Employed
100% of Promoter Shares are Pledged
Market Beating Performance
Total Returns (Price + Dividend) 
Brahmaputra Inf. for the last several years.
Risk Adjusted Returns v/s
Returns Beta

News

Brahmaputra Infrastructure Ltd is Rated Hold by MarketsMOJO
Brahmaputra Infrastructure Ltd is rated 'Hold' by MarketsMOJO, with this rating last updated on 01 June 2026. While the rating change occurred on that date, the analysis and financial metrics discussed here reflect the stock's current position as of 02 June 2026, providing investors with the latest insights into the company’s performance and outlook.
Read full news articleAre Brahmaputra Infrastructure Ltd latest results good or bad?
Brahmaputra Infrastructure Ltd's latest financial results for the quarter ending March 2026 present a complex picture characterized by revenue stability but significant challenges in profitability and operational efficiency. The company reported net sales of ₹93.92 crores, reflecting a year-on-year decline of 8.90% from ₹103.10 crores in the same quarter last year, although there was a modest sequential improvement of 1.48% from ₹92.55 crores in the previous quarter. The net profit for the quarter stood at ₹14.78 crores, which represents a substantial year-on-year decrease of 33.42% compared to ₹22.21 crores in Q4 FY25, alongside a slight decline of 2.31% from the previous quarter. This decline in profitability is underscored by a significant contraction in operating margins, which fell to 22.58% from 30.29% in the year-ago quarter, indicating persistent cost pressures and execution challenges. Despite m...
Read full news article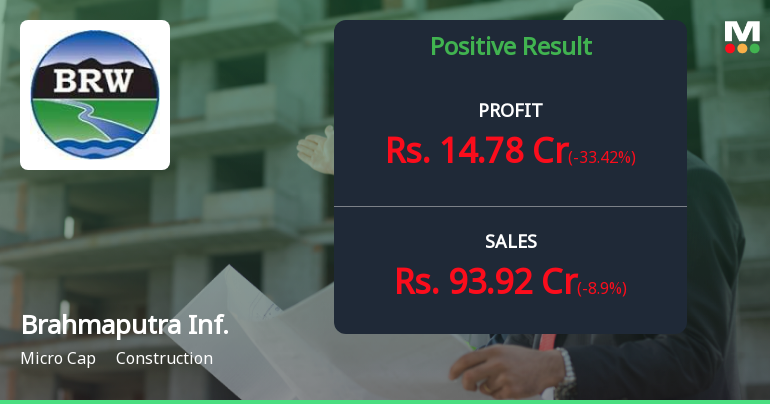
Brahmaputra Infrastructure Q4 FY26: Profit Decline Amid Margin Compression Raises Concerns
Brahmaputra Infrastructure Ltd., a Delhi-based engineering, procurement and construction (EPC) services provider with operations across northern, eastern and north-eastern India, reported a consolidated net profit of ₹14.78 crores for Q4 FY26, marking a decline of 33.42% year-on-year and 2.31% quarter-on-quarter. The micro-cap construction company, with a market capitalisation of ₹511.16 crores, witnessed its stock surge 4.98% to ₹176.15 following the results announcement, reflecting investor optimism despite the profit contraction.
Read full news article Announcements
Announcement under Regulation 30 (LODR)-Earnings Call Transcript
04-Jun-2026 | Source : BSEEarning Call Transcript held on 01st June 2026 on Audited March Results 31 2026.
Announcement under Regulation 30 (LODR)-Newspaper Publication
01-Jun-2026 | Source : BSENewspaper Publication as March 31 2026 Audited Results of the Company.
Announcement under Regulation 30 (LODR)-Earnings Call Transcript
01-Jun-2026 | Source : BSEAudio Recording on March 31 2026 Audited Results.
Corporate Actions

No Upcoming Board Meetings

No Dividend history available

No Splits history available

No Bonus history available

No Rights history available
Quality key factors
Valuation key factors
Technicals key factors
 Technical Indicator Scale: Bearish, Mildly Bearish, Sideways, Mildly Bullish, Bullish Turned
 Shareholding Snapshot : Mar 2026
Shareholding Compare (%holding)
Promoters
100
Held by 1 Schemes (0.42%)
Held by 0 FIIs
M. L. Singhi And Associates Private Limited (18.82%)
Udi Sales Private Limited (1.57%)
18.22%
Quarterly Results Snapshot (Consolidated) - Mar'26 - YoY

YoY Growth in quarter ended Mar 2026 is -8.90% vs 90.89% in Mar 2025
YoY Growth in quarter ended Mar 2026 is -33.42% vs 394.43% in Mar 2025
Half Yearly Results Snapshot (Consolidated) - Sep'25

Growth in half year ended Sep 2025 is 63.90% vs -2.29% in Sep 2024
Growth in half year ended Sep 2025 is 313.81% vs -3.11% in Sep 2024
Nine Monthly Results Snapshot (Consolidated) - Dec'25
YoY Growth in nine months ended Dec 2025 is 91.24% vs -13.81% in Dec 2024
YoY Growth in nine months ended Dec 2025 is 498.13% vs -40.88% in Dec 2024
Annual Results Snapshot (Consolidated) - Mar'26
YoY Growth in year ended Mar 2026 is 49.47% vs 11.77% in Mar 2025
YoY Growth in year ended Mar 2026 is 100.74% vs 73.06% in Mar 2025
About Brahmaputra Infrastructure Ltd

Company Coordinates


