
Compare BridgeBio Pharma, Inc. with Similar Stocks
Dashboard
With a Negative Book Value, the company has a Weak Long Term Fundamental Strength
- Poor long term growth as Operating profit has grown by an annual rate -27.00% of over the last 5 years
- Company's ability to service its debt is weak with a poor EBIT to Interest (avg) ratio of -8.52
Flat results in Jun 25
Risky - Negative EBITDA
Stock DNA
Pharmaceuticals & Biotechnology
USD 15,060 Million (Small Cap)
NA (Loss Making)
NA
0.00%
-1.06
40.39%
-7.79
Total Returns (Price + Dividend) 
BridgeBio Pharma, Inc. for the last several years.
Risk Adjusted Returns v/s
News
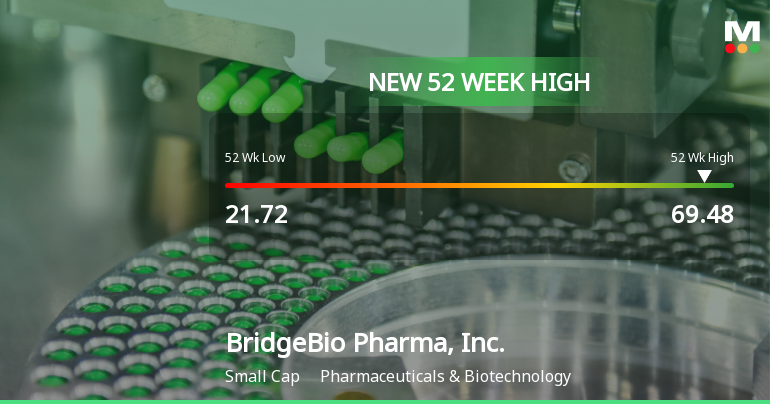
BridgeBio Pharma Hits New 52-Week High of $69.48, Up 139.38%
BridgeBio Pharma, Inc. has achieved a new 52-week high, reflecting a substantial increase in its stock performance over the past year. The company, with a market capitalization of USD 10,715 million, showcases strong operational efficiency despite being currently loss-making, highlighted by its notable return on equity.
Read full news article Announcements

Corporate Actions
Quality key factors
Valuation key factors
Technicals key factors
 Technical Indicator Scale: Bearish, Mildly Bearish, Sideways, Mildly Bullish, Bullish Turned
 Shareholding Snapshot : Sep 2025
Shareholding Compare (%holding)
Domestic Funds
Held in 88 Schemes (31.51%)
Held by 147 Foreign Institutions (10.96%)
Quarterly Results Snapshot (Consolidated) - Jun'25 - QoQ

QoQ Growth in quarter ended Jun 2025 is -5.15% vs 1,876.27% in Mar 2025
QoQ Growth in quarter ended Jun 2025 is -8.37% vs 36.57% in Mar 2025
Annual Results Snapshot (Consolidated) - Dec'24

YoY Growth in year ended Dec 2024 is 2,286.02% vs -88.02% in Dec 2023
YoY Growth in year ended Dec 2024 is 16.84% vs -34.78% in Dec 2023
About BridgeBio Pharma, Inc.

Company Coordinates


