
Compare Brigade Enterpr. with Similar Stocks
Total Returns (Price + Dividend) 
Latest dividend: 1.8714110191412312 per share ex-dividend date: Aug-13-2025
Risk Adjusted Returns v/s
Returns Beta

News

Brigade Enterprises Ltd Downgraded to Strong Sell Amid Mixed Technicals and Expensive Valuation
Brigade Enterprises Ltd, a small-cap player in the realty sector, has seen its investment rating downgraded from Sell to Strong Sell as of 17 Jun 2026. This shift reflects a complex interplay of deteriorating financial trends, expensive valuation metrics, and mixed technical signals, despite some mild improvements in market momentum. Investors are advised to carefully consider these factors amid the company’s recent underperformance relative to broader market benchmarks.
Read full news article
Brigade Enterprises Ltd Valuation Shifts Signal Changing Market Sentiment
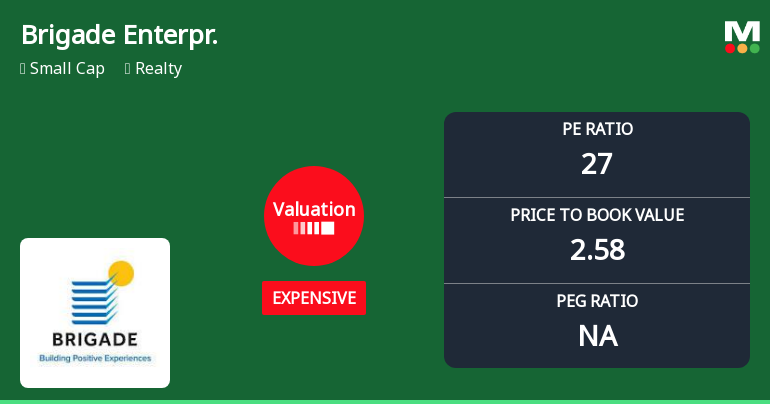
Brigade Enterprises Ltd, a key player in the Indian realty sector, has seen its valuation parameters shift notably, raising questions about its price attractiveness amid a volatile market backdrop. Recent data reveals a transition from fair to expensive valuation grades, with key metrics such as the price-to-earnings (P/E) and price-to-book value (P/BV) ratios climbing, prompting a reassessment of the stock’s investment appeal.
Read full news article Announcements
Announcement under Regulation 30 (LODR)-Allotment of ESOP / ESPS
18-Jun-2026 | Source : BSEGrant of 203496 options under the Brigade Employee Stock Option Plan on adjustment for bonus issue
Announcement under Regulation 30 (LODR)-Press Release / Media Release
18-Jun-2026 | Source : BSEPress Release
Announcement under Regulation 30 (LODR)-Allotment
18-Jun-2026 | Source : BSEAllotment of Bonus Equity Shares and Issue of additional stock options for adjustment towards bonus issue
Corporate Actions

No Upcoming Board Meetings

Brigade Enterprises Ltd has declared 25% dividend, ex-date: 13 Aug 25

No Splits history available

Brigade Enterprises Ltd has announced 1:3 bonus issue, ex-date: 17 Jun 26

No Rights history available
Quality key factors
Valuation key factors
Technicals key factors
 Technical Indicator Scale: Bearish, Mildly Bearish, Sideways, Mildly Bullish, Bullish Turned
 Shareholding Snapshot : Mar 2026
Shareholding Compare (%holding)
Promoters
0.1144
Held by 30 Schemes (22.29%)
Held by 177 FIIs (16.75%)
Mysore Ramachandrasetty Jaishankar (14.13%)
Icici Prudential Housing Opportunities Fund (4.56%)
12.54%
Quarterly Results Snapshot (Consolidated) - Mar'26 - QoQ

QoQ Growth in quarter ended Mar 2026 is -7.46% vs 13.86% in Dec 2025
QoQ Growth in quarter ended Mar 2026 is -22.00% vs 14.78% in Dec 2025
Half Yearly Results Snapshot (Consolidated) - Sep'25

Growth in half year ended Sep 2025 is 23.94% vs 6.40% in Sep 2024
Growth in half year ended Sep 2025 is 54.11% vs 17.83% in Sep 2024
Nine Monthly Results Snapshot (Consolidated) - Dec'25
YoY Growth in nine months ended Dec 2025 is 17.32% vs 13.13% in Dec 2024
YoY Growth in nine months ended Dec 2025 is 13.66% vs 78.78% in Dec 2024
Annual Results Snapshot (Consolidated) - Mar'26
YoY Growth in year ended Mar 2026 is 12.28% vs 3.63% in Mar 2025
YoY Growth in year ended Mar 2026 is -6.03% vs 51.85% in Mar 2025
About Brigade Enterprises Ltd

Company Coordinates


