Britannia Inds.

INR
4,970.00
-41 (-0.82%)
BSENSE

Sep 11, 03:30 PM

BSE+NSE Vol: 3.37 lacs

  • Price Points
  • Score
  • Mojo Parameters
  • Total Return
  • News and Corporate Actions
  • Key factors
  • Shareholding
  • Financials
  • CompanyCV
stock-summaryPrice Point
High/Low

1Day

52 Week

Valuation
Technical
Day's Volume

CASH

3.37 lacs (18.55%) Volume

Shareholding (Jun 2026)

FII

13.40%

Held by 729 FIIs

DII

20.93%

Held by 34 DIIs

Promoter

50.55%

Why is Britannia Industries Ltd falling/rising?

06-Sep-2026

As of 05-Sep, Britannia Industries Ltd's stock price is Rs 5,104.00, down 1.85%, reflecting significant underperformance against the market and declining investor interest, compounded by concerns over long-term growth prospects. The stock is trading near its 52-week low and shows bearish trends across various moving averages.

As of 05-Sep, Britannia Industries Ltd's stock price is falling, currently at Rs 5,104.00, reflecting a decrease of Rs 95.95 or 1.85%. This decline can be attributed to several factors highlighted in the provided data. <BR><BR>Firstly, the stock has underperformed significantly compared to the broader market, with a one-week decline of 3.89% against a 0.97% drop in the Sensex. Over the past month, the stock has also decreased by 3.89%, while the Sensex fell by only 2.44%. Year-to-date, Britannia's stock has dropped by 15.37%, compared to a 10.21% decline in the Sensex, indicating a consistent trend of underperformance.<BR><BR>Additionally, the stock is trading close to its 52-week low, just 1.29% above the low of Rs 5,038. Today's performance has been particularly weak, as it underperformed its sector by 1.67% and reached an intraday low of Rs 5,090, marking a 2.11% decline. The stock is also trading below its 5-day, 20-day, 50-day, 100-day, and 200-day moving averages, which suggests a bearish trend.<BR><BR>Investor participation appears to be declining, with delivery volume dropping by 36.09% compared to the 5-day average, indicating reduced interest from investors. Although the company shows strong management efficiency and a solid ability to service debt, these positive factors are overshadowed by poor long-term growth prospects, as evidenced by a modest annual growth rate of 8.28% in net sales and a 6.6% decline in profit after tax in the latest quarter.<BR><BR>Furthermore, the stock's valuation appears expensive with a Price to Book Value of 24.1, despite trading at a discount compared to its peers' historical valuations. The negative sentiment is compounded by the stock's significant decline of 16.09% over the past year, despite a profit increase of 18.7%, leading to a high PEG ratio of 2.5, which suggests that the stock may not be a good value at its current price.<BR><BR>In summary, the combination of underperformance relative to the market, declining investor interest, and concerns over long-term growth prospects are key reasons for the falling stock price of Britannia Industries Ltd.

View full answer

Who are in the management team of Britannia Inds.?

01-Sep-2026

The management team of Britannia Industries includes Chairman Nusli N Wadia, Executive Vice Chairman & Managing Director Varun Berry, CEO Rajneet Singh Kohli, CFO Venkataraman Natarajan, and several Non-Executive & Independent Directors, bringing diverse expertise to the company.

The management team of Britannia Industries includes the following key members:<BR><BR>1. **Nusli N Wadia** - Chairman (Non-Executive)<BR>2. **Varun Berry** - Executive Vice Chairman & Managing Director<BR>3. **Rajneet Singh Kohli** - Executive Director & CEO<BR>4. **Venkataraman Natarajan** - Executive Director & CFO<BR>5. **Keki Dadiseth** - Non-Executive & Independent Director<BR>6. **Avijit Deb** - Non-Executive & Independent Director<BR>7. **Ajai Puri** - Non-Executive & Independent Director<BR>8. **Ness N Wadia** - Non-Executive & Non-Independent Director<BR>9. **Y S P Thorat** - Non-Executive & Independent Director<BR>10. **Ajay Shah** - Non-Executive & Independent Director<BR>11. **Keki Elavia** - Non-Executive & Independent Director<BR>12. **Tanya Arvind Dubash** - Non-Executive & Independent Director<BR>13. **T V Thulsidass** - Company Secretary & Compliance Officer<BR><BR>This diverse team brings a wealth of experience and expertise to the company.

View full answer

What does Britannia Inds. do?

01-Sep-2026

Britannia Industries Limited is a leading Indian FMCG company that produces biscuits, bread, cakes, rusk, and dairy products. As of June 2026, it reported net sales of ₹5,000 Cr and a net profit of ₹591 Cr, with a market cap of ₹126,456 Cr.

Overview: <BR>Britannia Industries Limited (BIL) is one of India's leading FMCG companies, specializing in a diverse range of products including biscuits, bread, cakes, rusk, and dairy items.<BR><BR>History: <BR>Britannia Industries was incorporated in the early 20th century and has since established itself as a prominent player in the FMCG sector. The latest quarterly results reported net sales and net profit for June 2026.<BR><BR>Financial Snapshot: <BR>- Net Sales: 5,000 Cr (Quarterly Results - Jun 2026) <BR>- Net Profit: 591 Cr (Quarterly Results - Jun 2026) <BR>- Market Cap: INR 126,456 Cr (Large Cap) <BR><BR>Key Metrics: <BR>- P/E: 49.00 <BR>- Industry P/E: 44 <BR>- Dividend Yield: 1.70% <BR>- Debt-Equity: -0.12 <BR>- Return on Equity: 49.61% <BR>- Price to Book: 25.05 <BR><BR>Contact Details: <BR>Address: 5/1/A Hungerford Street, Kolkata West Bengal: 700017 <BR>Tel: 91-033-22872439/2057/2287 <BR>Email: investorrelations@britindia.com <BR>Website: http://www.britannia.co.in

View full answer

Who are the peers of the Britannia Inds.?

01-Sep-2026

Britannia Inds. peers include Hind. Unilever, ITC, Nestle India, Tata Consumer, and others, with Nestle India showing the highest 1-year return at 27.55% and Britannia Inds. at -9.89%. Management risk varies, with excellent ratings for several peers, while growth is generally below average for most.

Peers: The peers of Britannia Inds. are Hind. Unilever, ITC, Nestle India, Tata Consumer, Godrej Consumer, Dabur India, Colgate-Palmoliv, Cupid, Godfrey Phillips, and P&G Hygiene.<BR><BR>Quality Snapshot: Excellent management risk is observed at Hind. Unilever, ITC, Nestle India, Britannia Inds., Colgate-Palmoliv, and Godfrey Phillips, while Good management risk is found at Godrej Consumer and Dabur India. Average management risk is present at Tata Consumer and Cupid, and the rest have varying ratings. Growth is rated as Good for Nestle India and Tata Consumer, while Below Average growth is noted for Hind. Unilever, ITC, Britannia Inds., Godrej Consumer, Dabur India, Colgate-Palmoliv, and P&G Hygiene, with Cupid showing Good growth. Capital Structure is rated Excellent across all peers.<BR><BR>Return Snapshot: The peer with the highest 1-year return is Nestle India at 27.55%, while the lowest is ITC at -37.46%. Britannia Inds. has a 1-year return of -9.89%, which is better than ITC but worse than Nestle India. Additionally, several peers, including ITC, Godrej Consumer, Dabur India, Colgate-Palmoliv, Godfrey Phillips, and P&G Hygiene, have negative six-month returns.

View full answer

How big is Britannia Inds.?

01-Sep-2026

As of 31st August, Britannia Industries Ltd has a market capitalization of 126,456.00 Cr, with recent net sales of 19,529.34 Cr and a net profit of 2,604.12 Cr.

As of 31st August, Britannia Industries Ltd has a market capitalization of 126,456.00 Cr, categorizing it as a Large Cap company.<BR><BR>In the latest four quarters, Britannia Industries reported Net Sales of 19,529.34 Cr and a Net Profit of 2,604.12 Cr.<BR><BR>The latest annual period for the balance sheet is March 2026, with Shareholder's Funds amounting to 5,106.56 Cr and Total Assets totaling 9,688.93 Cr.

View full answer

Should I buy, sell or hold Britannia Industries Ltd?

20-Aug-2026

Are Britannia Industries Ltd latest results good or bad?

08-May-2026

Britannia Industries Ltd's latest results show a year-on-year net profit growth of 21.14%, indicating improved profitability, but a quarter-on-quarter decline in net profit and sales raises concerns about short-term growth and margins, leading to mixed investor sentiment. Overall, while long-term profitability looks positive, recent performance trends suggest challenges.

Britannia Industries Ltd's latest results present a mixed picture. On one hand, the company reported a consolidated net profit of ₹678.34 crore, which reflects a significant year-on-year growth of 21.14%. This indicates that, compared to the same quarter last year, the company has improved its profitability.<BR><BR>However, there are concerning signs when looking at the quarter-on-quarter performance. The net profit saw a slight decline of 0.24% from the previous quarter, and net sales dropped by 5.05% sequentially, which raises questions about the company's short-term growth momentum. Additionally, the operating margin has compressed to 18.20%, down 186 basis points from the previous quarter, signaling potential cost pressures or increased competition in the FMCG sector.<BR><BR>Overall, while the year-on-year profit growth is a positive aspect, the sequential declines in sales and margins suggest challenges that could impact investor sentiment. The market has reacted negatively, reflecting skepticism about the company's high valuation, which is currently considered expensive. Therefore, the results can be seen as good in terms of long-term profitability but concerning in the context of recent performance trends.

View full answer

When is the next results date for Britannia Industries Ltd?

04-Feb-2026

The next results date for Britannia Industries Ltd is 10 February 2026.

The next results date for Britannia Industries Ltd is scheduled for 10 February 2026.

View full answer

Is Britannia Inds. overvalued or undervalued?

11-Nov-2025

As of November 10, 2025, Britannia Industries is considered overvalued with a PE Ratio of 63.75 and an EV to EBITDA of 46.03, making it more expensive than peers like Hindustan Unilever and Godrej Consumer, despite a strong year-to-date stock performance of 28.64%.

As of 10 November 2025, the valuation grade for Britannia Industries has moved from very expensive to expensive, indicating a slight adjustment in its perceived value. The company is currently considered overvalued based on its high valuation ratios. Key ratios include a PE Ratio of 63.75, an EV to EBITDA of 46.03, and a PEG Ratio of 8.34, all of which are significantly higher than industry norms.<BR><BR>In comparison to its peers, Britannia's PE Ratio is notably higher than Hindustan Unilever's 53.51 and Godrej Consumer's 61.47, both categorized as expensive. Additionally, while Britannia's EV to EBITDA is 46.03, Hindustan Unilever's stands at 33.13, further emphasizing the relative overvaluation of Britannia. Despite its strong recent stock performance, with a year-to-date return of 28.64% compared to the Sensex's 6.91%, the high valuation ratios suggest that the stock may not be a prudent investment at its current price of 6132.15.

View full answer

Is Britannia Inds. technically bullish or bearish?

07-Nov-2025

As of November 6, 2025, Britannia Inds. has a bullish trend with moderate strength, supported by positive monthly MACD and RSI signals, although some short-term caution is advised due to mildly bearish weekly indicators.

As of 6 November 2025, the technical trend for Britannia Inds. has changed from mildly bullish to bullish. The current stance is bullish with moderate strength. Key indicators driving this include a bullish signal from the monthly MACD and RSI, along with bullish readings from both the Bollinger Bands and daily moving averages. The weekly KST is bullish, although the weekly MACD and OBV show mildly bearish tendencies, indicating some short-term caution. Overall, the monthly outlook remains strong, supporting the bullish stance.

View full answer

How has been the historical performance of Britannia Inds.?

06-Nov-2025

Britannia Inds. has shown consistent growth in net sales and profits, with net sales increasing from 11,054.67 Cr in Mar'19 to 17,942.67 Cr in Mar'25, and profit after tax rising from 1,156.43 Cr to 2,188.60 Cr in the same period, despite some fluctuations in profit before tax. The company has also improved its total assets while reducing total liabilities, indicating overall financial resilience.

Answer:<BR>The historical performance of Britannia Inds. shows a consistent growth trend in net sales and profits over the years, although there are fluctuations in certain metrics.<BR><BR>Breakdown:<BR>Britannia Inds. has demonstrated a steady increase in net sales, rising from 11,054.67 Cr in Mar'19 to 17,942.67 Cr in Mar'25. Total operating income followed a similar trajectory, reaching 17,942.67 Cr in Mar'25, up from 11,054.67 Cr in Mar'19. The company's operating profit (PBDIT) also grew, peaking at 3,414.24 Cr in Mar'25, compared to 1,939.87 Cr in Mar'19. However, profit before tax showed some volatility, with a high of 3,027.36 Cr in Mar'23, followed by a slight decline to 2,937.31 Cr in Mar'25. Profit after tax reached 2,188.60 Cr in Mar'25, reflecting a gradual increase from 1,156.43 Cr in Mar'19. The company's total assets increased from 7,822.67 Cr in Mar'20 to 8,801.96 Cr in Mar'25, while total liabilities decreased from 9,295.47 Cr in Mar'23 to 8,801.96 Cr in Mar'25. Cash flow from operating activities showed a positive trend, amounting to 2,480.00 Cr in Mar'25, although the net cash outflow was recorded at -194.00 Cr for the same period. Overall, Britannia Inds. has shown resilience and growth in its financial performance over the years.

View full answer

Who are the top shareholders of the Britannia Inds.?

17-Jul-2025

The top shareholders of Britannia Industries include Associated Biscuits International Limited with 44.76%, mutual funds with 8.17%, foreign institutional investors at 15.72%, a qualified institutional buyer holding 5.32%, and individual investors owning 12.64%.

The top shareholders of Britannia Industries include the promoters, with Associated Biscuits International Limited holding the largest share at 44.76%. Additionally, the company has 35 mutual fund schemes that collectively hold 8.17% of the shares, while foreign institutional investors (FIIs) own 15.72% through 769 different entities. The highest public shareholder is a qualified institutional buyer, holding 5.32%, and individual investors collectively own 12.64% of the shares.

View full answer

What is the bonus history of the Britannia Inds.?

06-Jun-2025

Britannia Industries Ltd's most recent bonus issue was a 1:1 bonus announced on May 25, 2021, with a record date of May 27, 2021, granting shareholders one additional share for each share owned.

Britannia Industries Ltd has a notable bonus history, with its latest bonus issue being a 1:1 bonus announced on May 25, 2021. The record date for this bonus was May 27, 2021. This means that shareholders received one additional share for every share they owned as of the record date.

View full answer

Has Britannia Inds. declared dividend?

06-Jun-2025

Yes, Britannia Industries Ltd has declared a dividend of 7350% (₹73.5 per share), with an ex-date of August 5, 2024. The dividend yield is 1.32%, and the company has shown positive total returns across various periods.

Britannia Industries Ltd has declared a dividend of 7350%.<BR><BR>Dividend Details:<BR>- Percentage announced: 7350%<BR>- Amount per share: 73.5<BR>- Ex-date: 05 Aug 24<BR><BR>Dividend Yield: 1.32%.<BR><BR>Total Returns by Period:<BR>In the 6-month period, the price return was 14.31%, with a dividend return of 0%, resulting in a total return of 14.31%.<BR><BR>For the 1-year period, the price return was 2.33%, the dividend return was 1.33%, leading to a total return of 3.66%.<BR><BR>Over the 2-year period, the price return was 18.43%, the dividend return was 1.47%, culminating in a total return of 19.9%.<BR><BR>In the 3-year period, the price return was 59.55%, with a dividend return of 4.27%, resulting in a total return of 63.82%.<BR><BR>For the 4-year period, the price return was 59.56%, the dividend return was 5.51%, leading to a total return of 65.07%.<BR><BR>In the 5-year period, the price return was 60.67%, with a dividend return of 10.16%, culminating in a total return of 70.83%.<BR><BR>Overall, Britannia Industries Ltd has declared a substantial dividend, which contributes to a positive total return across various periods, indicating a strong performance in both price appreciation and dividend yield.

View full answer
iScoreScore
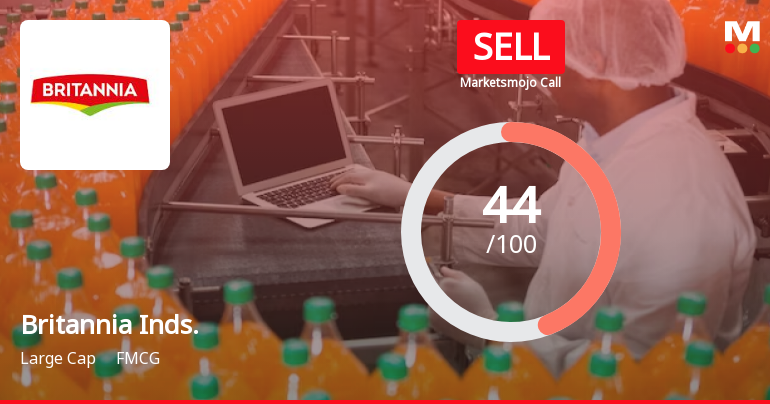
Click here to find our call on this stock
Strong Sell
Sell
Hold
Buy
Strong Buy

Dashboard

1

Poor long term growth as Net Sales has grown by an annual rate of 8.28% and Operating profit at 8.93% over the last 5 years

 
2

Flat results in Jun 26

3

With ROE of 49.6, it has a Expensive valuation with a 23.4 Price to Book Value

4

Below par performance in long term as well as near term

stock-summaryMojo Parameters

Mojo Parameters

Loading Valuation Snapshot...

Stock DNA

stock-summary
Industry

FMCG

stock-summary
Market cap

INR 119,230 Cr (Large Cap)

stock-summary
P/E

46.00

stock-summary
Industry P/E

43

stock-summary
Dividend Yield

1.81%

stock-summary
Debt Equity

-0.12

stock-summary
Return on Equity

49.61%

stock-summary
Price to Book

23.64

Revenue and Profits:
Net Sales:
5,000 Cr
(Quarterly Results - Jun 2026)
Net Profit:
591 Cr
stock-summaryTotal Returns
Total Returns (Price + Dividend) stock-summary
Dividend Yield (1.81%)
TimePeriod
Price Return
Dividend Return
Total Return
3 Months
-2.73%
1.74%
-0.99%
6 Months
-16.05%
1.55%
-14.5%
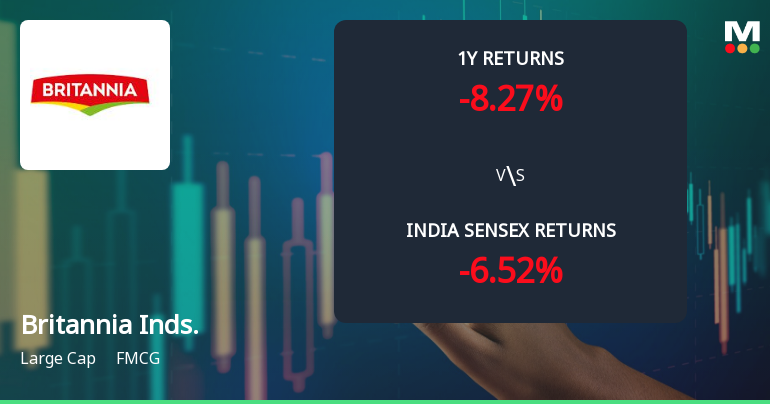
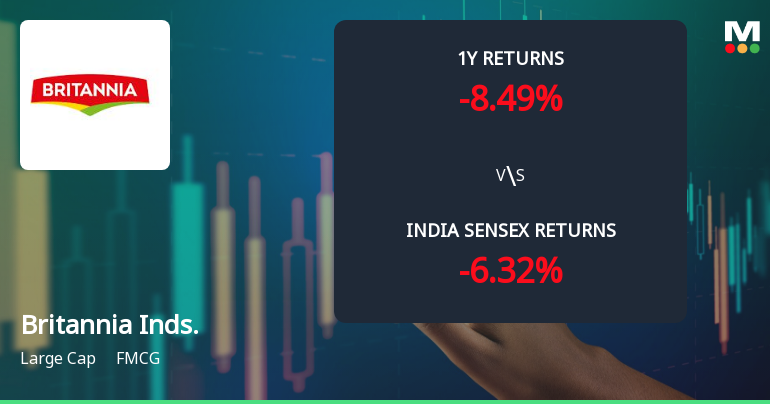
1 Year
-21.12%
1.49%
-19.63%
2 Years
-17.22%
2.67%
-14.55%
3 Years
8.86%
5.29%
14.15%
4 Years
36.14%
8.25%
44.39%
5 Years
22.12%
9.46%
31.58%

Latest dividend: 90.51421128959255 per share ex-dividend date: Jul-31-2026

Risk Adjusted Returns v/s stock-summary
Returns Beta
Icon
Beta has not been calculated since enough price history is not available
stock-summaryNews & Corporate Actions

Announcements stock-summary

Announcement under Regulation 30 (LODR)-Analyst / Investor Meet - Intimation

10-Sep-2026 | Source : BSE

Pursuant to Regulation 30 read with Clause 15 of Para A of

Announcement under Regulation 30 (LODR)-Change in Management

31-Aug-2026 | Source : BSE

Pursuant to Regulation 30 read with Clause 7 of Para A of Part A of Schedule III of the SEBI Regulations 2015 this is to inform you that Mr. Susheel Navanale Chief Information Officer of the Company will retire from the services of the Company with effect from close of business on 30th September 2026.

Disclosure Of Environmental Social And Governance (ESG) Rating Under Regulation 30 Of The Securities And Exchange Board Of India (Listing Obligations And Disclosure Requirements) Regulations 2015.

27-Aug-2026 | Source : BSE

Pursuant to Regulation 30 read with Clause 3 of Para A of Part A of Schedule III of the SEBI Listing Regulations 2015 this is to inform you that Crisil ESG Ratings & Analytics Limited a SEBI Registered Category - I ESG Rating Provider has independently assigned Crisil ESG Rating of 66 under the category Strong and Crisil Core ESG Rating of 64 to the Company vide its Report dated 26th August 2026 on the basis of publicly available information disclosed by the Company pertaining to FY 2025-26.

Corporate Actions stock-summary

stock-summary
BOARD MEETING

No Upcoming Board Meetings

stock-summary
DIVIDEND

Britannia Industries Ltd has declared 9050% dividend, ex-date: 31 Jul 26

stock-summary
SPLITS

Britannia Industries Ltd has announced 1:2 stock split, ex-date: 29 Nov 18

stock-summary
BONUS

Britannia Industries Ltd has announced 1:1 bonus issue, ex-date: 25 May 21

stock-summary
RIGHTS

No Rights history available

stock-summaryKey Factors

Quality key factors stock-summary

Factor
Value
Sales Growth (5y)
8.28%
EBIT Growth (5y)
8.93%
EBIT to Interest (avg)
20.06
Debt to EBITDA (avg)
0.86
Net Debt to Equity (avg)
-0.12
Sales to Capital Employed (avg)
2.91
Tax Ratio
22.89%
Dividend Payout Ratio
82.93%
Pledged Shares
0
Institutional Holding
34.33%
ROCE (avg)
60.74%
ROE (avg)
54.22%

Valuation key factors

Factor
Value
P/E Ratio
46
Industry P/E
43
Price to Book Value
23.44
EV to EBIT
36.17
EV to EBITDA
32.83
EV to Capital Employed
26.49
EV to Sales
6.10
PEG Ratio
2.46
Dividend Yield
1.82%
ROCE (Latest)
71.35%
ROE (Latest)
49.61%

Technicals key factors

Indicator
Weekly
Monthly
MACD
Bearish
Mildly Bearish
RSI
No Signal
Bullish
Bollinger Bands
Bearish
Bearish
Moving Averages
Bearish (Daily)
KST
Mildly Bullish
Mildly Bearish
Dow Theory
Mildly Bearish
Mildly Bearish
OBV
Mildly Bearish
Mildly Bearish
stock-summary Technical Indicator Scale: Bearish, Mildly Bearish, Sideways, Mildly Bullish, Bullish  Turned 
stock-summaryShareholding
Shareholding Snapshot : Jun 2026stock-summary
Shareholding Compare (%holding) stock-summary
Majority shareholders

Promoters

Pledged Promoter Holdings

None

Mutual Funds

Held by 40 Schemes (12.25%)

FIIs

Held by 729 FIIs (13.4%)

Promoter with highest holding

Associated Biscuits International Limited (44.76%)

Highest Public shareholder

Icici Prudential India Opportunities Fund (4.34%)

Individual Investors Holdings

12.37%

stock-summaryFinancial
[
  {
    "link": "quarterly",
    "btn_text": "All Quarterly Results",
    "header": "Quarterly Results Snapshot (Consolidated) - Jun'26 - QoQ",
    "rhs": [
      {
        "prefix": "Net Sales ",
        "suffix": "QoQ Growth in quarter ended Jun 2026 is 5.96% vs -5.05% in Mar 2026",
        "dir": 1
      },
      {
        "prefix": "Consolidated Net Profit ",
        "suffix": "QoQ Growth in quarter ended Jun 2026 is -12.82% vs -0.24% in Mar 2026",
        "dir": -1
      }
    ],
    "table": {
      "header": [
        "Jun'26",
        "Mar'26",
        "Change(%)"
      ],
      "body": [
        {
          "field": "Net Sales",
          "val1": "4,999.97",
          "val2": "4,718.92",
          "chgp": "5.96%",
          "chgp_class": "positive"
        },
        {
          "field": "Operating Profit (PBDIT) excl Other Income",
          "val1": "840.11",
          "val2": "852.87",
          "chgp": "-1.50%",
          "chgp_class": "negative"
        },
        {
          "field": "Interest",
          "val1": "22.87",
          "val2": "18.68",
          "chgp": "22.43%",
          "chgp_class": "negative"
        },
        {
          "field": "Exceptional Items",
          "val1": "0.00",
          "val2": "0.00",
          "chgp": "",
          "chgp_class": "neutral"
        },
        {
          "field": "Consolidate Net Profit",
          "val1": "591.35",
          "val2": "678.34",
          "chgp": "-12.82%",
          "chgp_class": "negative"
        },
        {
          "field": "Operating Profit Margin (Excl OI)",
          "val1": "16.92%",
          "val2": "18.20%",
          "chgp": "-1.28%",
          "chgp_class": "negative"
        }
      ]
    }
  },
  {
    "link": "half-yearly",
    "btn_text": "All Half Yearly Results",
    "header": "Half Yearly Results Snapshot (Consolidated) - Sep'25",
    "rhs": [
      {
        "prefix": "Net Sales ",
        "suffix": " Growth in half year ended Sep 2025 is 6.11% vs 5.62% in Sep 2024",
        "dir": 1
      },
      {
        "prefix": "Consolidated Net Profit ",
        "suffix": " Growth in half year ended Sep 2025 is 13.32% vs -0.77% in Sep 2024",
        "dir": 1
      }
    ],
    "table": {
      "header": [
        "Sep'25",
        "Sep'24",
        "Change(%)"
      ],
      "body": [
        {
          "field": "Net Sales",
          "val1": "9,462.85",
          "val2": "8,917.86",
          "chgp": "6.11%",
          "chgp_class": "positive"
        },
        {
          "field": "Operating Profit (PBDIT) excl Other Income",
          "val1": "1,711.57",
          "val2": "1,537.07",
          "chgp": "11.35%",
          "chgp_class": "positive"
        },
        {
          "field": "Interest",
          "val1": "60.83",
          "val2": "63.59",
          "chgp": "-4.34%",
          "chgp_class": "positive"
        },
        {
          "field": "Exceptional Items",
          "val1": "0.00",
          "val2": "-24.79",
          "chgp": "100.00%",
          "chgp_class": "positive"
        },
        {
          "field": "Consolidate Net Profit",
          "val1": "1,175.19",
          "val2": "1,037.09",
          "chgp": "13.32%",
          "chgp_class": "positive"
        },
        {
          "field": "Operating Profit Margin (Excl OI)",
          "val1": "18.43%",
          "val2": "17.68%",
          "chgp": "0.75%",
          "chgp_class": "positive"
        }
      ]
    }
  },
  {
    "link": "nine-monthly",
    "btn_text": "All Nine Monthly Results",
    "header": "Nine Monthly Results Snapshot (Consolidated) - Dec'25",
    "rhs": [
      {
        "prefix": "Net Sales ",
        "suffix": "YoY Growth in nine months ended Dec 2025 is 6.83% vs 6.38% in Dec 2024",
        "dir": 1
      },
      {
        "prefix": "Consolidated Net Profit ",
        "suffix": "YoY Growth in nine months ended Dec 2025 is 14.60% vs 1.08% in Dec 2024",
        "dir": 1
      }
    ],
    "table": {
      "header": [
        "Dec'25",
        "Dec'24",
        "Change(%)"
      ],
      "body": [
        {
          "field": "Net Sales",
          "val1": "14,432.67",
          "val2": "13,510.47",
          "chgp": "6.83%",
          "chgp_class": "positive"
        },
        {
          "field": "Operating Profit (PBDIT) excl Other Income",
          "val1": "2,691.56",
          "val2": "2,381.97",
          "chgp": "13.00%",
          "chgp_class": "positive"
        },
        {
          "field": "Interest",
          "val1": "94.08",
          "val2": "108.15",
          "chgp": "-13.01%",
          "chgp_class": "positive"
        },
        {
          "field": "Exceptional Items",
          "val1": "0.00",
          "val2": "-24.79",
          "chgp": "100.00%",
          "chgp_class": "positive"
        },
        {
          "field": "Consolidate Net Profit",
          "val1": "1,855.15",
          "val2": "1,618.78",
          "chgp": "14.60%",
          "chgp_class": "positive"
        },
        {
          "field": "Operating Profit Margin (Excl OI)",
          "val1": "18.65%",
          "val2": "17.63%",
          "chgp": "1.02%",
          "chgp_class": "positive"
        }
      ]
    }
  },
  {
    "link": "annual",
    "btn_text": "All Annual Results",
    "header": "Annual Results Snapshot (Consolidated) - Mar'26",
    "rhs": [
      {
        "prefix": "Net Sales ",
        "suffix": "YoY Growth in year ended Mar 2026 is 6.74% vs 7.00% in Mar 2025",
        "dir": -1
      },
      {
        "prefix": "Consolidated Net Profit ",
        "suffix": "YoY Growth in year ended Mar 2026 is 16.28% vs 1.82% in Mar 2025",
        "dir": 1
      }
    ],
    "table": {
      "header": [
        "Mar'26",
        "Mar'25",
        "Change(%)"
      ],
      "body": [
        {
          "field": "Net Sales",
          "val1": "19,151.59",
          "val2": "17,942.67",
          "chgp": "6.74%",
          "chgp_class": "positive"
        },
        {
          "field": "Operating Profit (PBDIT) excl Other Income",
          "val1": "3,544.43",
          "val2": "3,187.15",
          "chgp": "11.21%",
          "chgp_class": "positive"
        },
        {
          "field": "Interest",
          "val1": "112.76",
          "val2": "138.80",
          "chgp": "-18.76%",
          "chgp_class": "positive"
        },
        {
          "field": "Exceptional Items",
          "val1": "0.00",
          "val2": "-24.79",
          "chgp": "100.00%",
          "chgp_class": "positive"
        },
        {
          "field": "Consolidate Net Profit",
          "val1": "2,533.49",
          "val2": "2,178.73",
          "chgp": "16.28%",
          "chgp_class": "positive"
        },
        {
          "field": "Operating Profit Margin (Excl OI)",
          "val1": "18.80%",
          "val2": "18.18%",
          "chgp": "0.62%",
          "chgp_class": "positive"
        }
      ]
    }
  }
]

Quarterly Results Snapshot (Consolidated) - Jun'26 - QoQstock-summary

Jun'26
Mar'26
Change(%)
Net Sales
4,999.97
4,718.92
5.96%
Operating Profit (PBDIT) excl Other Income
840.11
852.87
-1.50%
Interest
22.87
18.68
22.43%
Exceptional Items
0.00
0.00
Consolidate Net Profit
591.35
678.34
-12.82%
Operating Profit Margin (Excl OI)
16.92%
18.20%
-1.28%
Values in Rs Cr.
Direction Arrows
Net Sales

QoQ Growth in quarter ended Jun 2026 is 5.96% vs -5.05% in Mar 2026

Direction Arrows
Consolidated Net Profit

QoQ Growth in quarter ended Jun 2026 is -12.82% vs -0.24% in Mar 2026

Half Yearly Results Snapshot (Consolidated) - Sep'25stock-summary

Sep'25
Sep'24
Change(%)
Net Sales
9,462.85
8,917.86
6.11%
Operating Profit (PBDIT) excl Other Income
1,711.57
1,537.07
11.35%
Interest
60.83
63.59
-4.34%
Exceptional Items
0.00
-24.79
100.00%
Consolidate Net Profit
1,175.19
1,037.09
13.32%
Operating Profit Margin (Excl OI)
18.43%
17.68%
0.75%
Values in Rs Cr.
Direction Arrows
Net Sales

Growth in half year ended Sep 2025 is 6.11% vs 5.62% in Sep 2024

Direction Arrows
Consolidated Net Profit

Growth in half year ended Sep 2025 is 13.32% vs -0.77% in Sep 2024

Nine Monthly Results Snapshot (Consolidated) - Dec'25stock-summary

Dec'25
Dec'24
Change(%)
Net Sales
14,432.67
13,510.47
6.83%
Operating Profit (PBDIT) excl Other Income
2,691.56
2,381.97
13.00%
Interest
94.08
108.15
-13.01%
Exceptional Items
0.00
-24.79
100.00%
Consolidate Net Profit
1,855.15
1,618.78
14.60%
Operating Profit Margin (Excl OI)
18.65%
17.63%
1.02%
Values in Rs Cr.
Direction Arrows
Net Sales

YoY Growth in nine months ended Dec 2025 is 6.83% vs 6.38% in Dec 2024

Direction Arrows
Consolidated Net Profit

YoY Growth in nine months ended Dec 2025 is 14.60% vs 1.08% in Dec 2024

Annual Results Snapshot (Consolidated) - Mar'26stock-summary

Mar'26
Mar'25
Change(%)
Net Sales
19,151.59
17,942.67
6.74%
Operating Profit (PBDIT) excl Other Income
3,544.43
3,187.15
11.21%
Interest
112.76
138.80
-18.76%
Exceptional Items
0.00
-24.79
100.00%
Consolidate Net Profit
2,533.49
2,178.73
16.28%
Operating Profit Margin (Excl OI)
18.80%
18.18%
0.62%
Values in Rs Cr.
Direction Arrows
Net Sales

YoY Growth in year ended Mar 2026 is 6.74% vs 7.00% in Mar 2025

Direction Arrows
Consolidated Net Profit

YoY Growth in year ended Mar 2026 is 16.28% vs 1.82% in Mar 2025

stock-summaryCompany CV
About Britannia Industries Ltd stock-summary
stock-summary
Britannia Industries Ltd
Large Cap
FMCG
Britannia Industries Limited (BIL) is one of India's leading FMCG companies. Britannia's product portfolio includes Biscuits, Bread, Cakes, Rusk, and Dairy products including Cheese, Beverages, Milk and Yoghurt. Its brand portfolio includes Tiger, Marie Gold, Good Day, 50:50, Treat, NutriChoice and Milk Bikis. BIL has a presence in more than 60 countries across the globe. The Company's international footprint includes presence in Middle East through local manufacturing in UAE and Oman.
Company Coordinates stock-summary
Company Details
5/1/A Hungerford Street , Kolkata West Bengal : 700017
stock-summary
Tel: 91-033-22872439/2057/2287
stock-summary
investorrelations@britindia.com
Registrar Details
Karvy Computershare Pvt Ltd., Karvy Selenium, Tower-B Plot No 31 & 32, Survey No 116/22, 115/24, 115/25, Financial District, Nanakramguda, Serilingampally, Mandal Ranga Reddy Dist, Hyderabad